
Related articles
October 2023 Review: Second month of industry declines, as robust inflows not enough to offset sharemarket fall
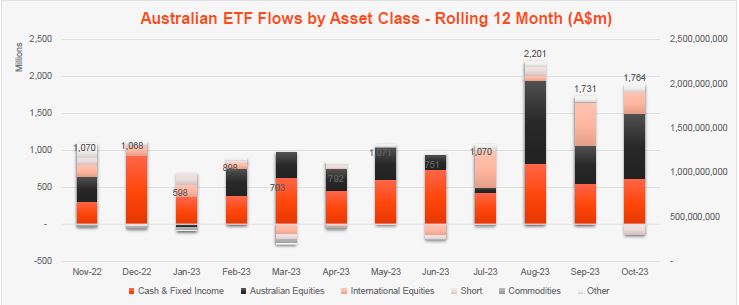
The second highest net flows of the calendar year were not enough to combat a decline in asset values, as global sharemarket falls caused the industry to decline in October, in a very similar pattern to that experienced in the prior month.
Exchanged Traded Funds Market Cap
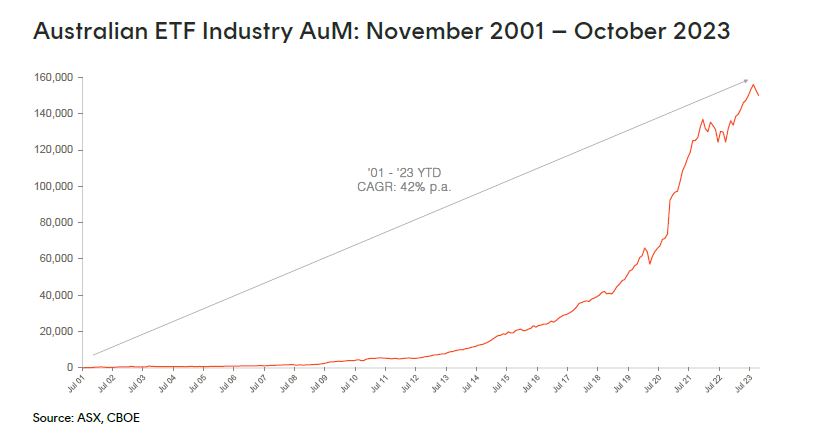
• Australian Exchange Traded Funds Market Cap (ASX + CBOE): $150.1B
• ASX CHESS Market Cap: $136.0B1
• Market Cap increase for month: -1.9%, -$2.8B
• Market cap growth for last 12 months: 14.0%, $18.4B
New Money
• Net inflows for month: $1.8B – 2nd highest net flows for 2023 to date
Products
• 349 Exchange Traded Products trading on the ASX & CBOE
• Only 1 new fund launched this month, as we launched a currency-hedged version of the FTSE 100 ETF, with the ASX code: H100.
• 2 closures this month, with Perpetual closing down their unlisted Global Innovation Fund which meant that the listed class (IDEA) similarly closed. In addition 1
Trading Value
• Trading value rose by ~10% in October, with ASX trading value of ~$10B for the month
Performance
• Cryptocurrency exposures were the best performers in October, followed by geared short Australian equities funds which rallied 10% for the month as the Australian sharemarket fell. With rising geopolitical tension we also saw gold exposures rise strong during the month.
Source: ASX, CBOE
Top category inflows (by $) – October 2023
| Broad Category | Inflow Value |
| Australian Equities | $881,882,798 |
| Fixed Income | $547,890,511 |
| International Equities | $288,924,951 |
| Cash | $70,663,720 |
| Listed Property | $58,325,102 |
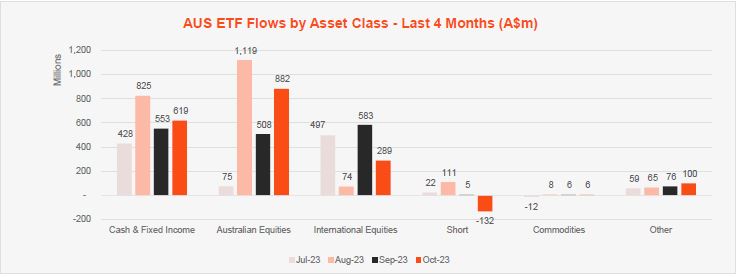
Comment: This month it was very much broad Australian equities exposures that led investor interest, with ~50% of the month’s flows ($882m) coming from this asset class. Fixed Income remained popular, and was the 2nd most popular exposure taking in ~$550m in new money.
Top sub-category inflows (by $) – October 2023
| Sub-category | Inflow Value |
| Australian Equities – Broad | $689,380,787 |
| Australian Bonds | $392,389,847 |
| Global Bonds | $166,403,667 |
| International Equities – Developed World | $159,379,613 |
| International Equities – US | $96,849,302 |
Source: ASX, CBOE
Top category outflows (by $) – October 2023
| Broad Category | Inflow Value |
| Short | ($131,999,193) |
| Currency | ($4,446,102) |
Comment: Outflows were low at a category level, with investors taking profits and selling out of short US and Australian equities products, which combined saw $132m of outflows.
Top sub-category outflows (by $) – October 2023
| Sub-Category | Inflow Value |
| US Equities – Short | ($88,727,867) |
| Australian Equities – Short | ($43,271,326) |
| International Equities – Sector | ($38,294,215) |
| International Equities – Asia | ($11,513,832) |
| Fixed Income – E&R – ESG Lite | ($7,768,722) |
*Past performance is not an indicator of future performance.
1. Since February 2023, the ASX started reporting additional data on a CHESS-only basis. The primary use of such data is that it excludes, amongst other things, the FuM and Flows in ‘dual class’ Active ETFs and potentially provide a more accurate picture of exchange traded activity.
-
H100
FTSE 100 Currency Hedged ETF
Investor & founder with a Financial Services & Fintech focus. Co-founder of Betashares. Passionate about entrepreneurship and startups.
Read more from Ilan.