8 minutes reading time
- The 2s10s yield curve spread un-inverts, marking potentially another turning point in this cycle, with the labour market now the key driver of the Fed’s reaction function.
- Inflation expectations plummet amid weakness in commodity prices.
- The global easing cycle gathers momentum, and China’s battle with deflation and broader commodity price declines are likely to have consequences for Australia.
Staying ahead of the curve
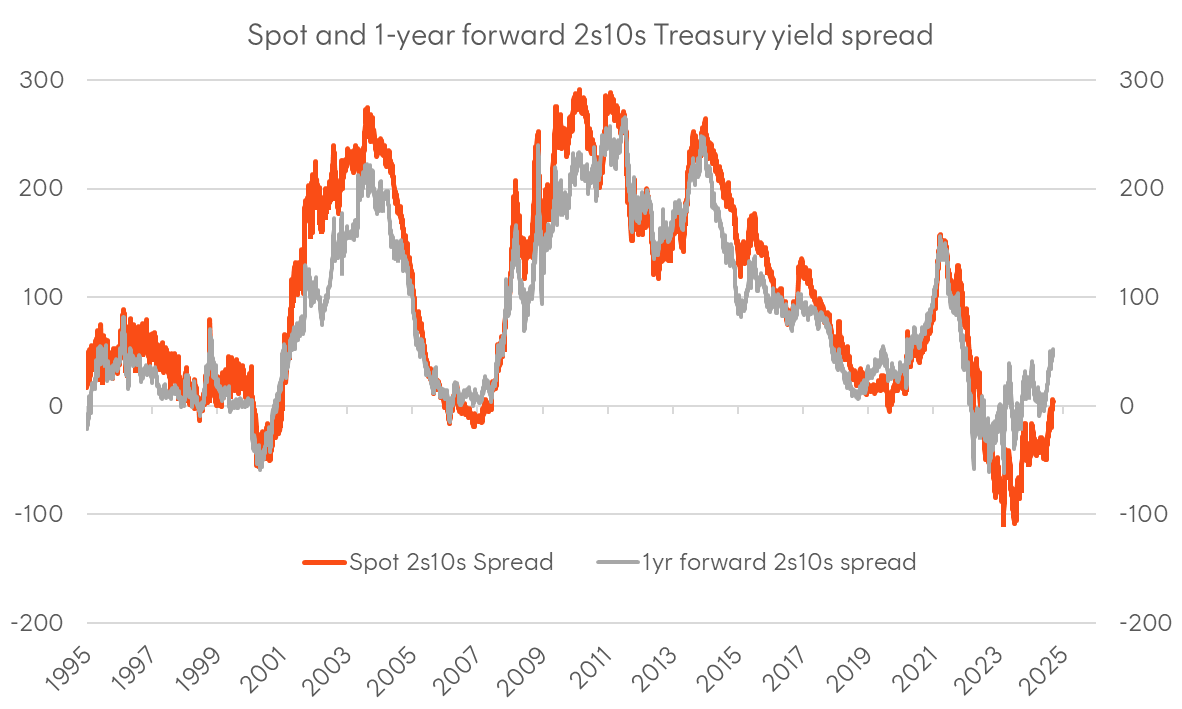
As we head into the much-anticipated September FOMC meeting, with the Fed clearly signalling the start of a cutting cycle, it’s worth taking stock of where we are. After two years of inversion, the US 2s10s Treasury spread (the difference between 10-year and 2-year yields) has finally returned to positive territory, with forward pricing implying the steepening will continue. This potentially marks yet another inflection in the macro cycle, with the baton now passed from inflation to growth and employment as the dominant risks for policymakers and markets.
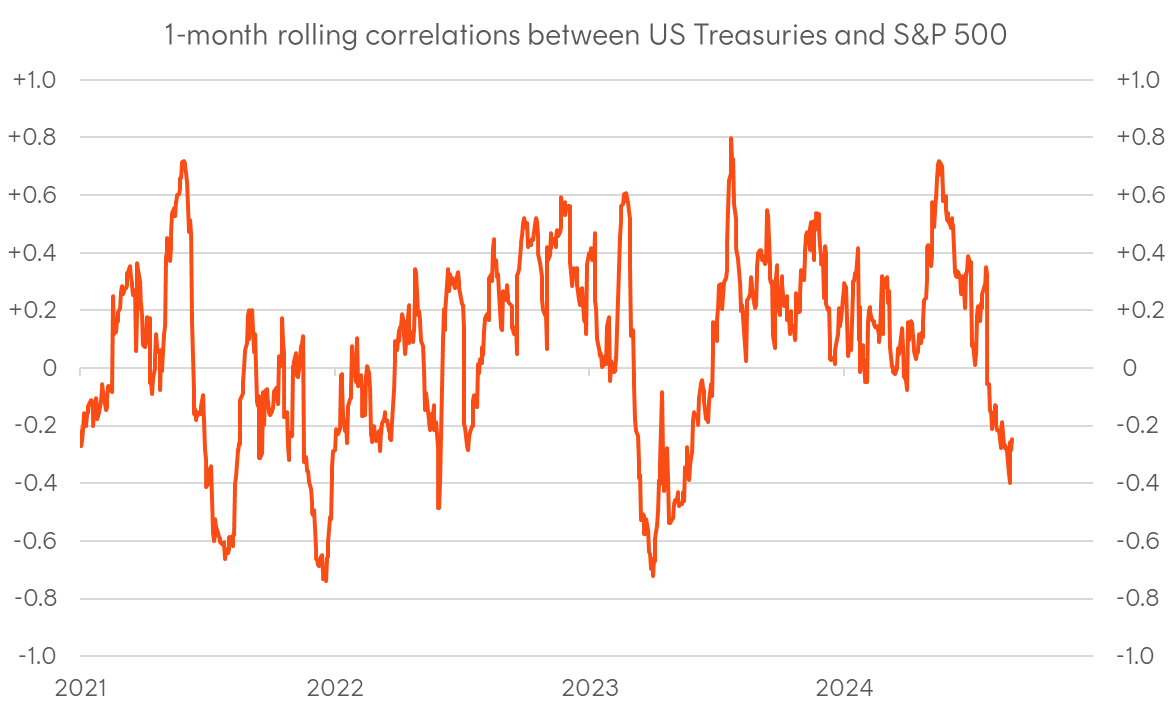
The soft-landing narrative is showing cracks amid the continued weakening of the US labour market, following a second consecutive “weak” payrolls print. This was accompanied by negative revisions and came on the heels of a larger downward revision of 800k jobs following the latest annual update from the BLS. Alongside the softening jobs picture, inflation expectations continue to plummet, forcing the rates market to take the idea of a Fed “policy error” more seriously, and this growing risk is reflected in the return correlation between US stocks and bonds turning negative.
Powell’s Jackson Hole speech made it clear that rate cuts will begin this month, and the size of cuts this cycle will largely depend on unemployment. However, plummeting inflation expectations amid a broad-based sell-off in commodities also suggest the Fed could quickly lose control of the narrative and fall too far behind the curve. While the rates market is still highly attuned to the growing risks of a hard landing, we’re seeing divergence in the signals sent by other markets. Equities are still choppy, with large-cap tech and AI darlings now in correction territory, but broader measures of the US equity market, like the equal-weight version of the S&P 500, recently made fresh all-time highs. Meanwhile, credit markets stay relatively calm, a modest widening in spreads notwithstanding.
While nothing is set in stone regarding the direction the US economy will take, and there is plenty of reflexivity in how the Fed’s actions, market responses, and financial conditions impact the US economy, there is a degree of inertia with an economy as large as the US. It took a while for rate hikes to cool inflation pressures and conversely it might be a while before rate cuts are able to support growth. This ensures that the balance of probability for rates is skewed to the downside. Continued labour market weakness, against a backdrop of falling inflation expectations, implies the Fed is moving further from neutral, raising the risk of a recession and increasing the likelihood they’ll need to take policy to accommodative levels.
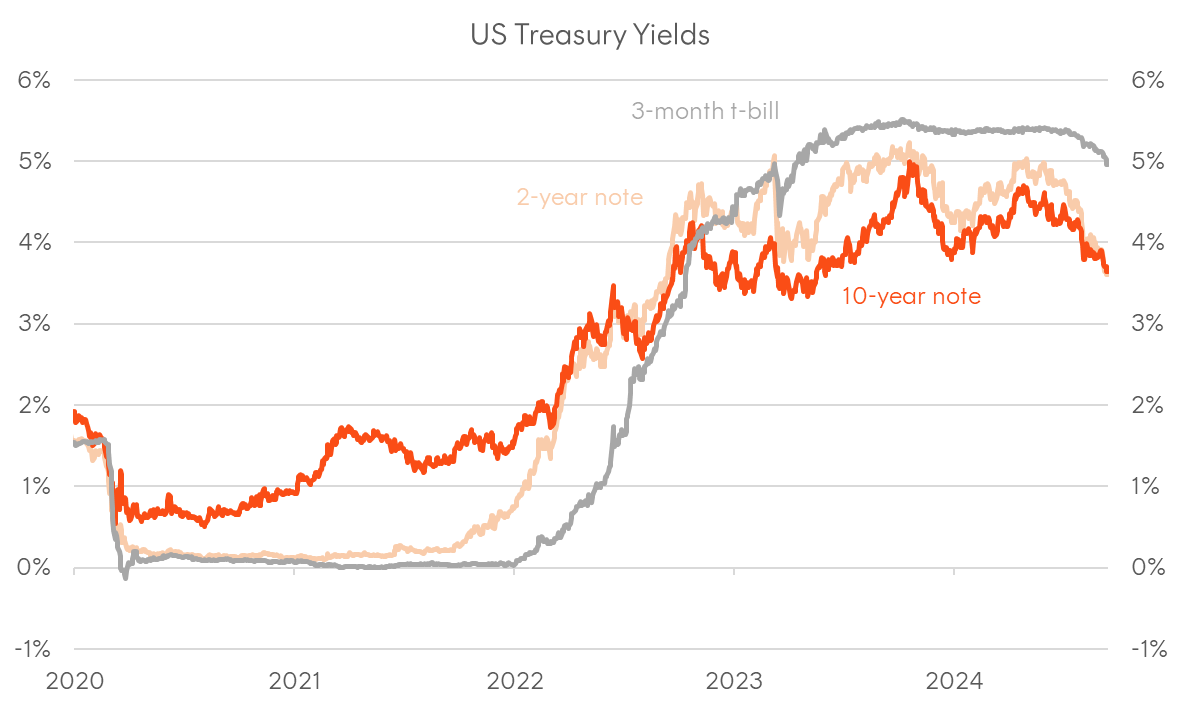
Chart 1: US Treasury Yields
Source: Bloomberg
Chart 2: US 2s10s Treasury spread and 1-year forward 2s10s spread
Source: Bloomberg
Chart 3: 1-month rolling correlation between US Treasuries and S&P 500
Source: Bloomberg
The Fed’s reaction function revisited
At the time of writing, there is significant debate about whether the Fed will cut rates by 25 or 50 basis points (with latest market pricing assigning a 30% probability of the latter). In my view, this largely depends on labour market data and given that the FOMC next week, it’s only jobless claims that could likely sway them. One bright spot from the most recent jobs report was that the official unemployment rate fell slightly (to 4.2% from 4.3% last month), although the broader U6 measure (which captures underemployment) continued to drift upwards.
However, whether they cut by 25 or 50 basis points doesn’t change the bigger picture, which is what ultimately matters for duration over the coming 12 months:
- The Fed will join the global easing cycle, with many other major economies experiencing growing economic weakness.
- Based on their own guidance, the Fed is still a long way from neutral.
- A soft landing requires policy moving to neutral, while growing risks of a hard landing increase the need for accommodative policy.
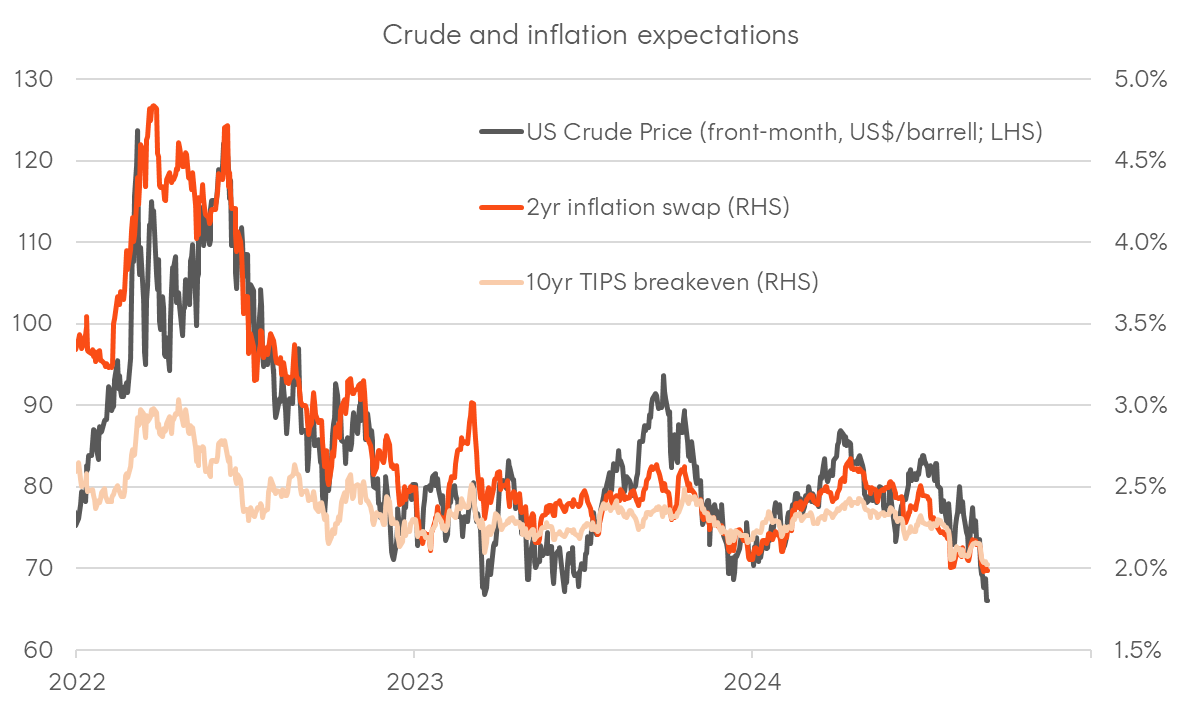
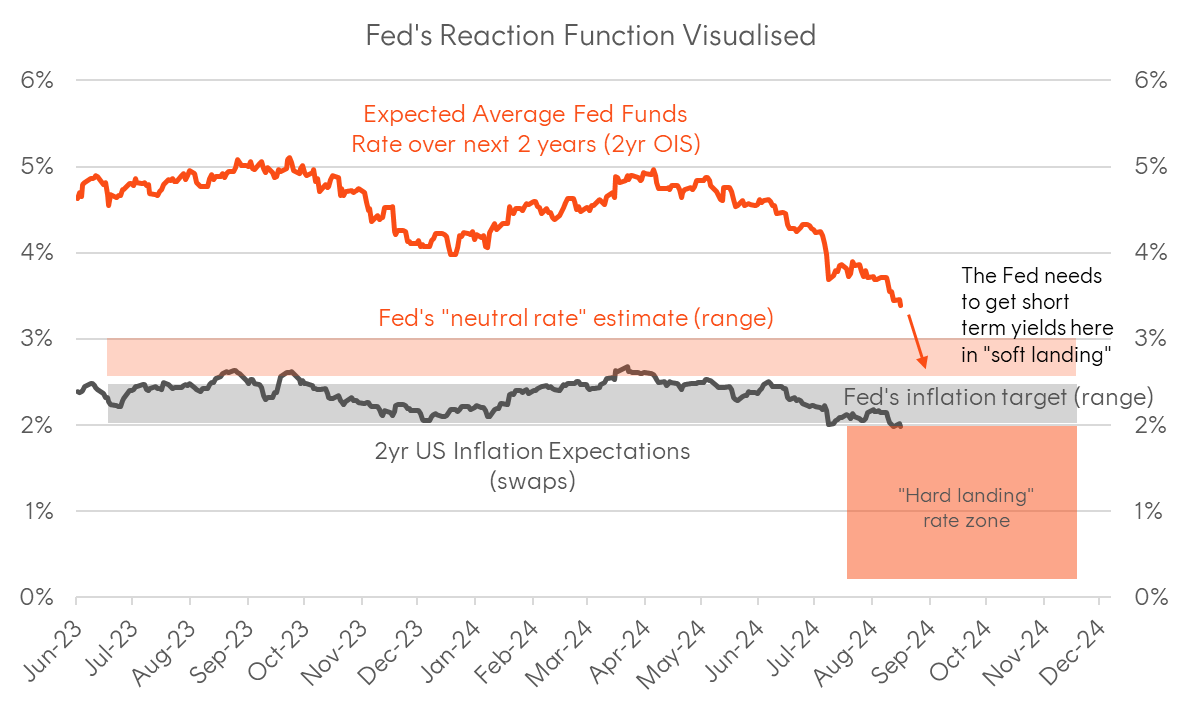
In the previous WHIB, I included a visual interpretation of the Fed’s reaction function, which I’ve updated below. It’s interesting to note that 2-year inflation expectations have continued to fall, dropping below 2% for the first time since late 2020. Short-term inflation expectations are heavily influenced by commodity prices – and crude is now at fresh cycle lows, while longer-term inflation expectations are shaped by the Fed’s policy credibility. With long-term inflation pricing (from both swaps and TIPS) also trending lower and risking a downside breach of 2%, the bond market is clearly expressing concern about the Fed making a policy error.
The base case for the size of Fed cuts ultimately depends on where they see “neutral”. Based on their dot plot (which will be updated at the FOMC meeting), the median long-run estimate from members is 2.75% (with a range between 2.375% and 3.75%). “Neutral”, in the Fed’s view, is at least 200 basis points below the current policy rate. Given the inflation and employment backdrop, their framework suggests they should move towards neutral as soon as possible (“insurance cuts”). The longer they wait, the greater the risk of a hard landing, increasing the likelihood of “emergency cuts” that could take policy rates below 2%.
Chart 4: Crude prices and US inflation expectations
Source: Bloomberg
Chart 5: Visual interpretation of the Fed’s reaction function
Source: Bloomberg, Betashares
Taking stock of the global easing cycle
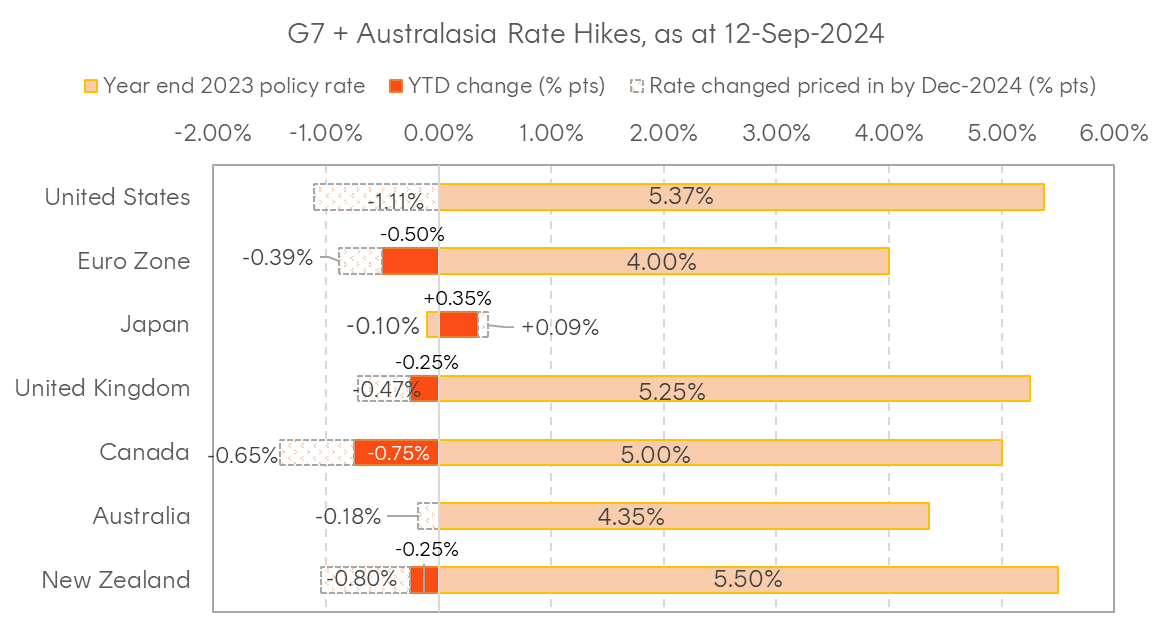
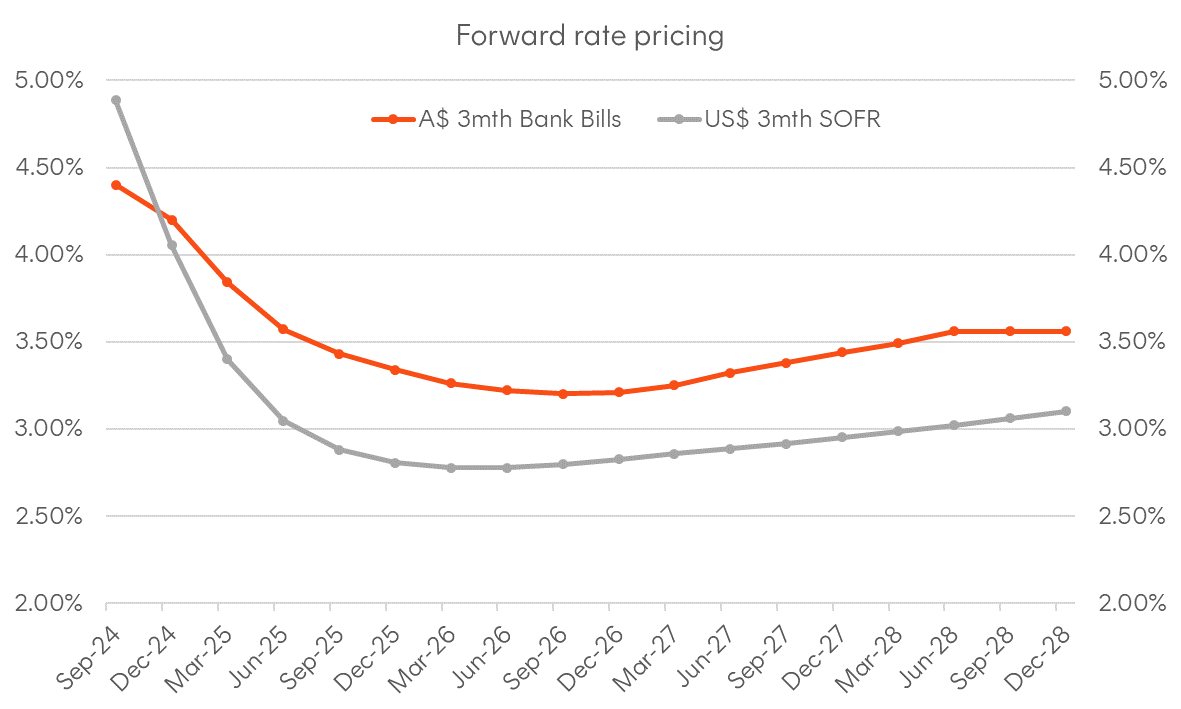
So far, we’ve seen rate cuts from Switzerland, Sweden, Canada, the Eurozone, New Zealand, the UK, and within the next fortnight, the Fed. Ignoring Japan, Australia remains the notable laggard. While the domestic press and local pundits are curiously fixated on inflation (and whether to blame the RBA or the government for it), it’s important to remember that Australia is a small, open economy, and the rest of the world has moved on. Policy, the economy, and markets in Australia do not exist in isolation from global forces. To me, the best predictor of what the RBA will do over the next 12 months is what the Fed does over the next six months.
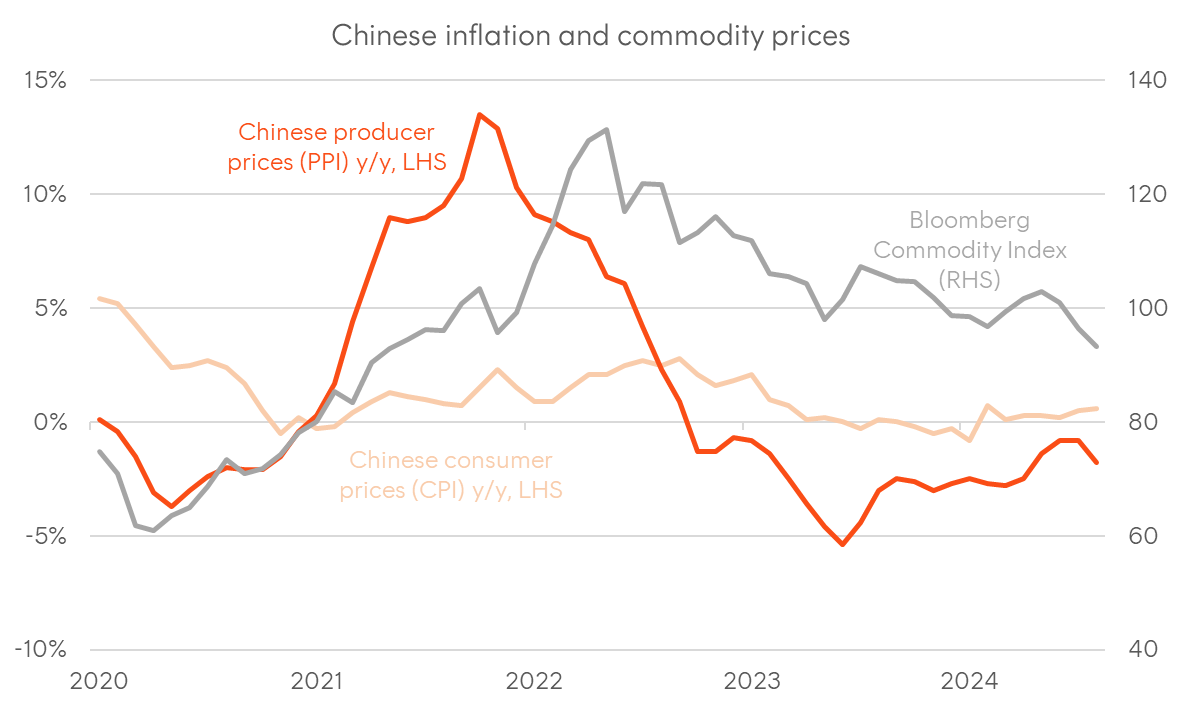
Additionally, let’s not forget China’s battle with deflation, stemming from a combination of weak domestic demand and excess capacity. This is not only a big disinflationary force for the global economy but presents a headwind for Australia’s external sector. Beyond China, we have other economies, like Canada appearing to be rapidly heading towards recession, and given the similarities with Australia – namely a highly indebted household sector that’s highly rate sensitive and an external sector and currency that’s dependent on commodities – it’s worth taking note.
Ultimately, whether we see a hard or soft landing in the US, duration has a policy-induced tailwind globally, and many investors—jaded after three years of inflation dominating portfolio risks—are likely under-exposed to fixed-rate bonds. Traditional, high quality fixed rate bonds provide favourable asymmetry, optionality and portfolio diversification at this part of the cycle.
Chart 6: The global easing cycle
Source: Bloomberg
Chart 7: Forward rate pricing from SOFR futures (US) and bank bill futures (Australia)
Source: Bloomberg
Chart 8: Chinese inflation and commodity prices
Source: Bloomberg; National Bureau of Statistics of China
