6 minutes reading time
- Bond yields on the rise despite the US rate cutting cycle just starting.
- Hedging of fiscal policy uncertainty ahead of the US election driving a higher US term premium?
- Gold rallying despite higher real yields.
A rates rollercoaster
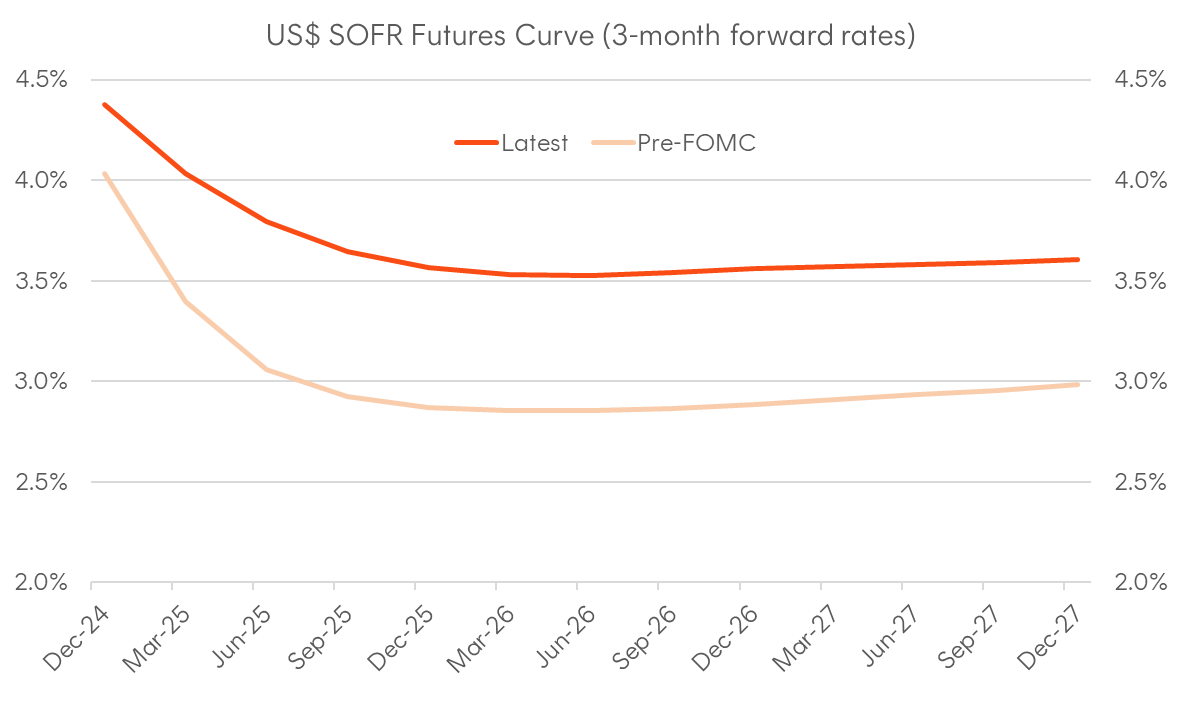
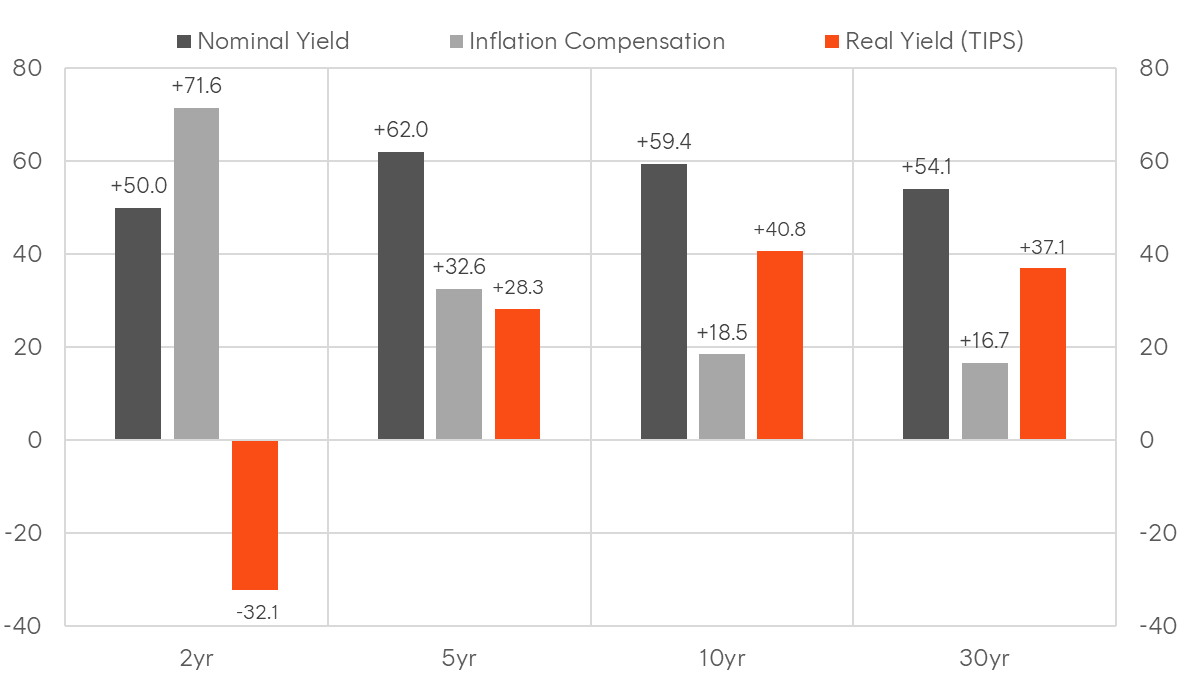
Over the past month, the movement in yields has defied what one might expect at the start of a US easing cycle, with 10-year yields trading 60 basis points higher since the September FOMC (and 10-year real yields up around 40bps). However, it’s important to recall that heading into the FOMC, the Treasury curve had already priced in a very aggressive cutting cycle, with forward rate expectations front-running the latest dot plot revision, suggesting rates would bottom out around 2.8% by the end of next year. Today, this trough in implied forwards is closer to 3.5%, reflecting stronger-than-expected US data and an increasing risk premium amid fiscal policy uncertainty as the US presidential election approaches.
To unpack this, let’s start with the data. Not only has the US labour market consistently surprised on the upside, but “nowcast” estimates of overall economic activity, such as the Atlanta Fed’s GDPNow model, suggest that the US economy is growing at over 3 per cent annualised in real terms. This above-trend growth significantly reduces the likelihood of a recession over the next 12 months. A reduced probability of a hard landing also decreases the likelihood that the Fed would need to lower rates below “neutral”, which is estimated at 2.9% based on their latest dot plot. Additionally, there’s an argument that the neutral level itself may be well above 3%, as the US economy has shown resilience amid the most aggressive tightening cycle in a generation, suggesting that the “neutral rate” could indeed be closer to 4%.
Turning to the risk premium (or “term premium” in the context of bonds) aspect of the selloff, it’s notable that the unwinding of rate cut expectations has not corresponded to a re-inversion of the yield curve, with the 2s10s spread is still positive. This implies a growing term premium, consistent with the rapid rise and steepening of real yields. Additionally, interest rate volatility has risen as hedging activity in the Treasury options market intensifies, particularly for expiry dates around the US election. The MOVE index, the VIX equivalent for US rates, now has an inverted term structure, with 1-month implied volatility well above the 3-month measure, consistent with hedging of event risk over the short term.
Chart 1: The change in forward rate expectations since the September FOMC meeting
Source: Bloomberg, as at 25/10/2024
Chart 2: US Treasury curve change since September FOMC meeting decomposed
Source: Bloomberg, as at 25/10/2024
The US Treasury term premium turns positive
In Q3 last year, there was an emerging narrative around the “term premium tantrum”, where US Treasuries sold off in a bear steepening fashion amid concerns around new issuance, resurrecting the spectre of “bond vigilantes” and bringing back memories of the September 2022 gilt crisis. The term premium has long been a point of debate in macro circles, as it is unobservable in real time and generally estimated through models. At its core, it represents the additional compensation investors require above forward rate expectations to take on the greater interest rate risk of long-term bonds, compared to rolling short-term bills.
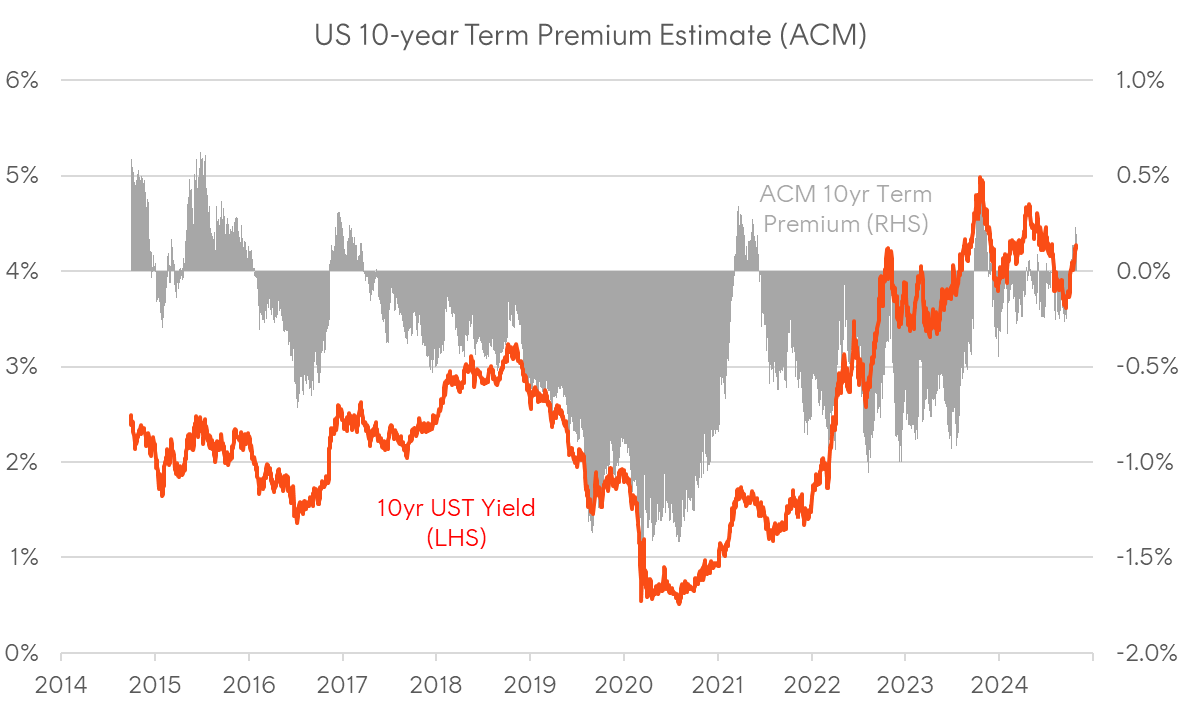
The most widely followed model of this metric is the ACM Term Premium model, developed by researchers at the New York Fed (see link for more information). This measure has been in negative territory for much of the past decade but recently turned positive—the first time since Q3 of last year. The last time the ACM 10-year term premium turned positive marked a favourable entry point for duration, with bonds staging a strong rally into year-end 2023. Looking forward, regardless of the election outcome, the mere resolution of uncertainty and expiry of hedges could be enough to drive a compression in term premium and push yields lower once again.
Chart 3: ACM 10-year US Term Premium Estimate
Source: NY Fed/Bloomberg
Chart 4: MOVE index of US Treasury yield volatility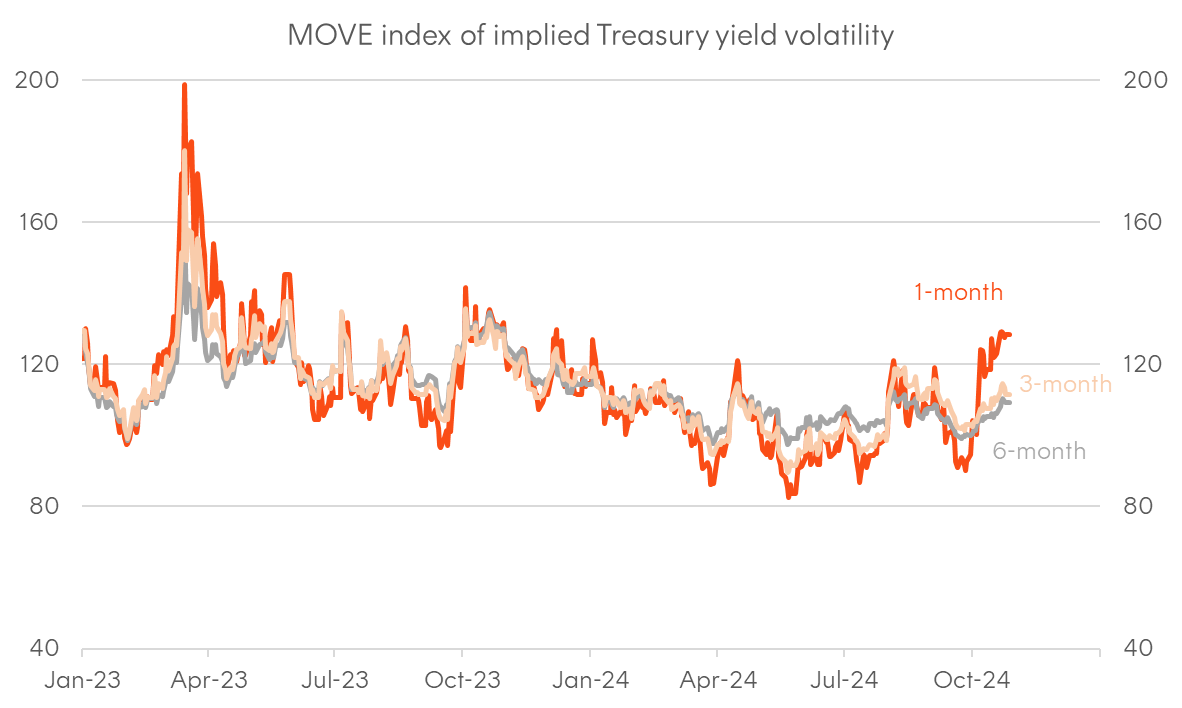
Source: ICE/Bloomberg
What the divergence between gold and bonds means
Another interesting aspect of the bond sell-off has been the rally in gold, which has defied its traditional relationship with real yields to reach fresh all-time highs. Not only has gold rallied alongside rising real yields, but it has done so just as the broad US dollar has rebounded. This divergence may signal a rising geopolitical risk premium, given gold’s role as a geopolitical hedge. However, as both gold and bond yields have risen while oil prices have softened, the story may extend beyond geopolitics to financial conditions and US budget deficits.
Typically, gold benefits when financial conditions ease. While many market-based measures of financial conditions remain accommodative, rising real yields and consolidating credit spreads make it difficult to argue that conditions have eased that much further recently. Another potential factor may be US fiscal policy, with gold often appreciating amid concerns about US budget deficits and government spending. Regardless of who will be in the White House, fiscal policy is expected to still be supportive, with the deficit outsized relative to the strength of the US private sector. The tail risk, which gold may be reflecting, is that a Trump White House and a Republican sweep of Congress raises the risk of the US economy overheating, potentially leaving financial conditions (based on the Fed’s current guidance) overly loose.
It’s worth noting that these deficit concerns differ from those observed in the UK in 2022 when gilts and the pound both sold off. Here, the US dollar has strengthened against developed currency peers. As a result, my view is the rally in gold suggests that the market is probably worried about both rising US budget deficits and increased Treasury issuance, while the US dollar strength reflects an expectation that the US economy will continue to outperform the rest of the world (and for the Fed to be less accommodative than other central banks). So far, risk assets have not been hurt materially by rising yields, consistent with bond investors’ pro-growth concerns. However, while the US equity market may not mind rising bond yields per se, it cares a lot about rising bond market volatility and outright yields reaching certain thresholds. Given the risk premium embedded in Treasury yields, the fact that real yields are back around 2%, and the skinny US equity risk premium, even marginally “bad” data could trigger a rotation back into bonds.
Chart 5: Gold and US real yields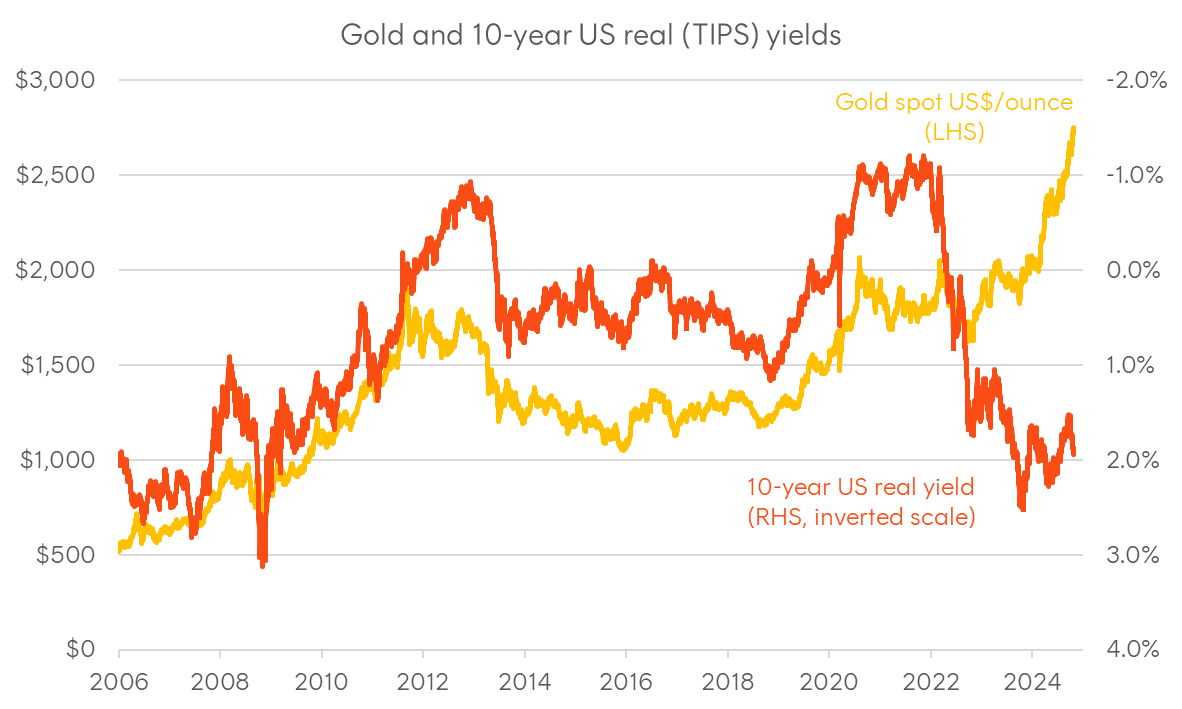
Source: Bloomberg
