
Chamath De Silva
11 minutes reading time
This information is for the use of licensed financial advisers and other wholesale clients only.
Commentary from the Betashares portfolio management desk by Head of Fixed Income Chamath De Silva, providing an overview on fixed income markets:
- The US yield curve remains inverted after 2 years, with no recession imminent
- Sovereign risk returns to the Eurozone, with all eyes on French politics
- A buyer’s strike in Australian state government bonds
A very long inversion
Before I went on leave, there wasn’t much to discuss in global macro, with yields largely in a holding pattern as softer US economic data was offset by some hawkish intermeeting comments from Fed officials. Interest rate volatility was trending lower as we entered the Northern Hemisphere summer and the soft landing narrative was gathering momentum.
However, in the past few weeks, we’ve seen the Bank of Canada and the ECB officially begin their rate-cutting cycles, the FOMC maintain an easing bias, and there has also been an escalation of political risk in Europe. Taken together, these factors have led to a sustained push lower in global yields, a drop in inflation breakevens, and a widening of credit spreads.
Before diving into the Eurozone story, I wanted to briefly touch on the June FOMC meeting and US Treasuries. My main takeaway is that the Fed is gradually reassessing how restrictive it needs to be. We now have slightly higher implied real policy rates for this year and 2025 compared to the March Summary of Economic Projections (SEP), in addition to higher long-run “neutral” nominal Fed funds rate expectations. That said, the market had already realised this some time ago, so any hawkish tweaks to the dots were well received by asset markets, given the Fed still has an easing bias.
What’s notable is that the US Treasury curve remains inverted in large segments, with the 2s10s spread still negative after two years. Historically, this indicator has had a good track record of predicting US recessions with a 12–24-month lead time, so perhaps this time truly is different. Was the yield curve ever inverted on recession risk, or was it simply a reflection of the market’s expectation that inflation would moderate, allowing the Fed to cut rates from a “restrictive” level to something closer to “neutral”? Additionally, the Fed’s own dot plot has endorsed the yield curve inversion since the hiking cycle began, and until the dot plots say otherwise, there probably isn’t a compelling reason for the curve to normalise.
To dig deeper into this yield curve topic, it’s worth elaborating on a question I was asked at a panel discussion in May: should we care about market pricing? It’s hard to argue that the forward rates market (whether Australian cash rate futures or US fed funds futures) has not frequently been wrong-footed throughout the post-pandemic period. It massively understated the degree of hiking throughout 2022, incorrectly priced in cuts following the US regional banking stress of March last year, and again priced in far too aggressive an easing cycle for 2024 at the start of the year.
My view is that while we shouldn’t necessarily trust market pricing as a forecasting tool, we should respect it when making asset allocation decisions. Ultimately, forward rates provide a reference point or the breakeven path of future interest rates for determining whether duration (i.e. fixed-rate bonds) will outperform cash.
At present, you would be indifferent between buying a 2-year Treasury at 4.7% and holding it to maturity and investing in (USD) cash if the path of future rates went from 5.3% to 3.7% by mid-2026.
Extending this analysis to a 10-year Treasury note with a yield of 4.2%, you’d be indifferent if future rates followed that same path to 2026 but kept falling to a low of 3.6% by 2028, before increasing to around 3.9% between 2028 and 2034.
It’s even more complicated when trying to assess whether the 10-year bond will outperform cash over the next 12 months. Remember that the 10-year bond will become a 9-year bond, and whether the yield increases or declines (which will impact the bond’s capital price in one year’s time) will largely depend on whether the implied future path of short-term interest rates appears more dovish (forward path tending to be lower) or hawkish than currently expected. This will depend on what the Fed delivers over the next 12 months compared to what’s priced in, and changes in Fed expectations for the relevant future dates beyond the next 12 months.
Now, as for the yield curve’s predictive power in anticipating recessions, we’re 2 years in with no recession imminent. That said, the inversion might still be a decent indicator for rate cuts (given that’s what’s implied) and a US recession is just one of many potential reasons the Fed might feel forced to cut, which leads us to Europe…
Figure 1: US 2s10s Treasury spread
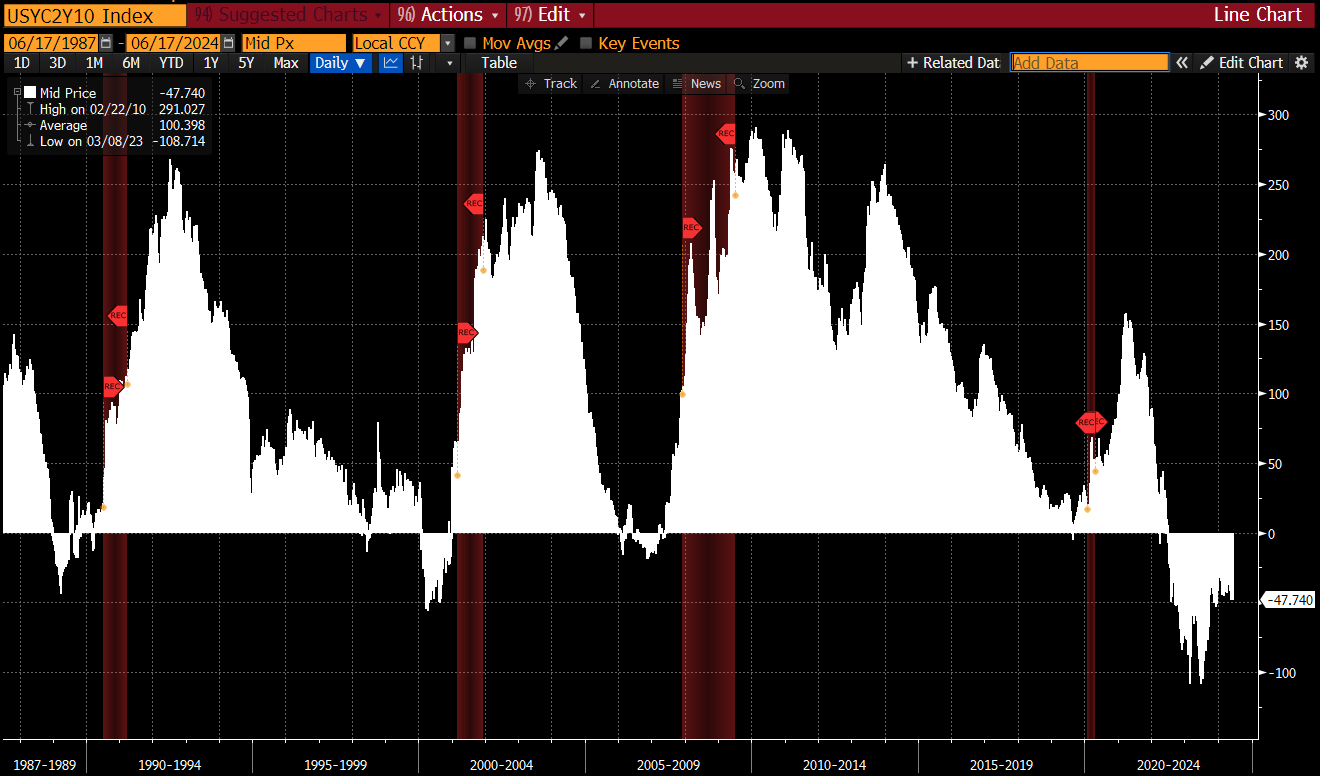
Source: Bloomberg
Figure 2: Change in US Treasuries over the past month; as at 14-Jun-2024

Source: Bloomberg
Figure 3: Changes in US forward interest rate curve; as at 14-June-2024

Source: Bloomberg
Sovereign risk returns to Europe
With risk premiums having compressed over much of the year as monetary policy uncertainty eased, it’s interesting to see that political developments are starting to move markets. The initial ruptures occurred in EM space, with surprise results from the Mexican and Indian elections sending their respective equity markets sharply lower, although the global economy and developed markets were seen as insulated. What’s happening in France is a different story altogether, and puts political risk squarely into focus, especially with UK and US elections also on the horizon.
President Macron’s surprise gambit to call snap national parliamentary elections (amid a surge from populist parties in the recent European parliamentary elections) has rekindled memories of the Eurozone crisis of the early 2010s.
The yield spread between French and German Government bonds (the so-called “OAT spread”) has widened sharply over the past week, and is already weighing on European risk assets more broadly. As Bloomberg’s John Authers recently remarked: “The OAT Spread is not one of those financial metrics you hear discussed very much. That’s good, because if people start talking about it, that’s almost certainly a bad thing. Like the plumbing in your house, you ignore it unless something goes wrong, and then nothing is more important.”
The worry for markets is two-fold. A populist French government would likely result growing French fiscal deficits at a time when the country is already running one of the higher debt-to-GDP ratios in the developed world. However, the big risk for Eurozone debt markets and the Euro is such a government might waver in its commitment to EU unity and the entire European project. Just like in the prior European debt crisis, the “fragmentation trade” might soon gain traction. Indeed, it’s no surprise that Italian and Greek spreads have already widened in sympathy with France, and the bloc is basically trading as Germany versus everyone else right now.
As someone who traded French sovereign bonds during the last Eurozone crisis, I can attest that the spread widening could get much, much worse. Although the spread level is nowhere near the wides of 2012, the repricing last week was comparable to the most volatile moves of the prior crisis.
There have also been many comparisons drawn between what’s happening in France now and what happened in the UK over the past eight years – not only Brexit but also the now-infamous mini-budget of the short-lived Truss Government in late 2022, which catalysed a simultaneous sell-off in UK gilts and the British pound. It’s worth flagging that while there are similarities on the surface, there are some major differences that arguably make the French situation potentially even worse.
Firstly, even though the UK was in the EU, it still retained monetary sovereignty before Brexit, whereas France is part of both the EU and the Eurozone monetary union, meaning any kind of “exit” would be far more disruptive for financial markets.
Second, the UK, for all the fiscal fears that emerged, ultimately could still “print” the currency its debt is denominated in. In contrast, France cannot unilaterally debase the Euro without support from the ECB.
Finally, France’s fiscal situation is arguably worse than the UK’s, with a public debt-to-GDP above 100%, and in a currency it doesn’t control.
Ultimately, credit risk is largely about low probability/high consequence scenarios. While the probability of a true sovereign debt crisis (like what we saw with Greece a decade ago) is still low, the potential consequences are almost beyond comprehension. Hedging activity alone could take spreads much wider, which will have profound implications for not only European banks and corporate credit but risk assets more broadly. The ECB has cut rates once, and if the moves in German yields are anything to go by, and depending on what happens at the French elections, it might have to ease policy much further.
Figure 4: 10-year France-Germany Sovereign Yield Spread

Source: Bloomberg
Figure 5: Public debt to GDP
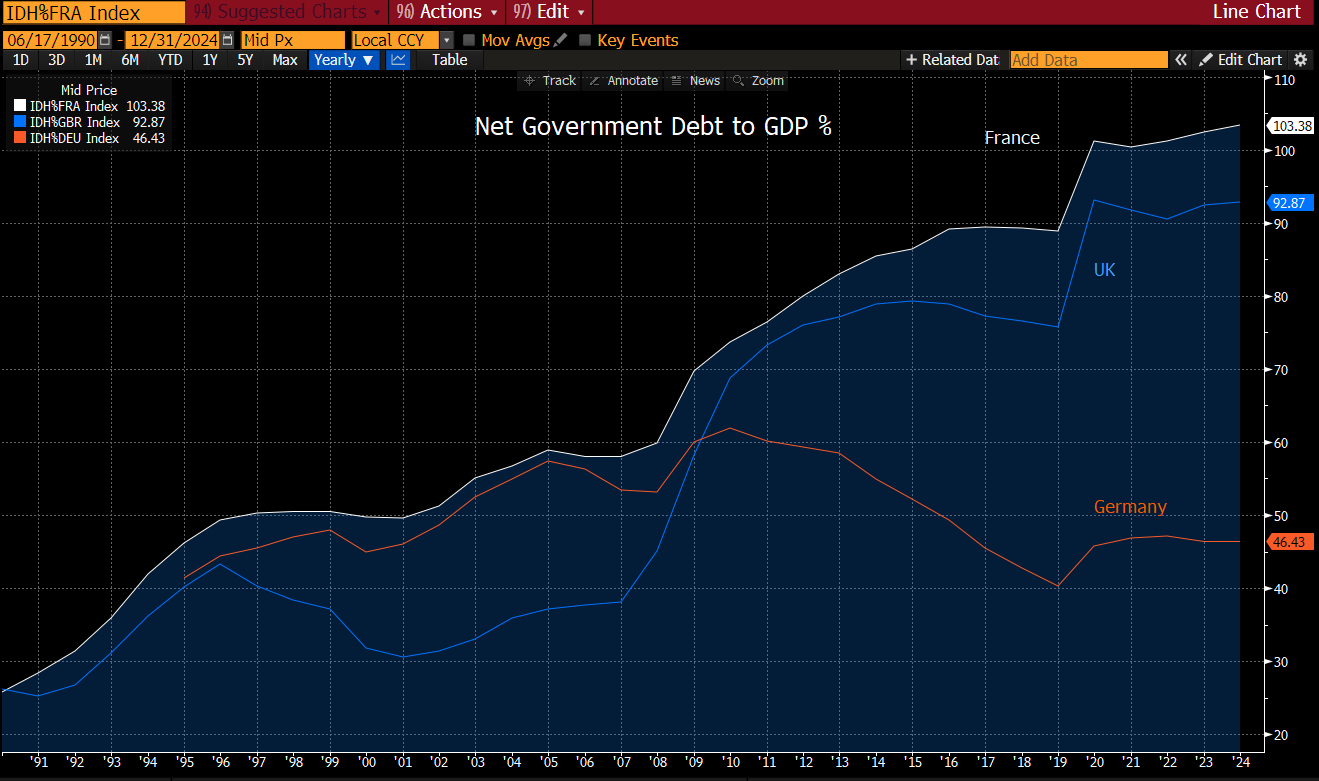
Sources: Bloomberg, IMF
A buyer’s strike in semis
On the topic of “high grade” credit wobbles, in Australia, we’ve had our version of the “OAT spread” blowing out, with spreads on state government bonds widening significantly against Commonwealth government securities (CGS).
In contrast to what’s happening in Europe, the “buyer’s strike” in semis has been slower-moving (and far less impactful for global markets). This reflects the deterioration in state government fiscal positions, especially in Victoria and NSW, amid large-scale infrastructure spending following on from pandemic-impacted budgets. Ten-year spreads on TCorp and TCV bonds have widened around 20 basis points since February, largely due to the indigestion of elevated supply. It’s worth noting that this spread widening occurred at a time when almost all other AUD credit spreads compressed, making semis the outlier in the domestic bond market.
Whether this continues depends on several factors. With what’s happening in Eurozone sovereign spreads, any credit contagion could spill over to high-grade spreads here (although a flight to quality bid would still support lower outright semi yields).
Furthermore, given the fiscal deterioration, there has been some commentary around risks to the AA credit rating of Victoria. A downgrade to the single “A” band would place the bonds below major bank senior credit and not far removed from Tier 2 major bank bonds. I personally feel that such risks are overblown, and semis will continue to command a privileged position in the domestic bond market, making the spread blowout a dip-buying opportunity.
One frustrating development for those managing credit duration positions in our bond market has been the very flat credit curves, where long-term credit spreads are trading around the same levels as short-dated credit spreads, in contrast to the historical norm, limiting the degree of rolldown one can harvest from spreads.
Semis are the big exception to this, with the curves of the various state governments now appearing “cheap” and “steep”, providing both a compelling yield pickup over CGS and a credit spread that widens with longer maturities, producing “steeply normal” curves on both an outright and spread basis.
In addition to being the steepest curves in the high-grade market (defined as CGS, semis, supranational, and government-related issuers), state government bonds are one of the few instruments (alongside CGS and deposits held directly with the RBA) to be designated as High-Quality Liquid Assets (HQLA) by the banking regulator. This distinction allows banks to hold them to meet their Liquidity Coverage Ratio (LCR) requirements, incentivising dip-buying when semi spreads widen against CGS. Due to their well-established history and favourable regulatory treatment, semis command a privileged place in our bond market, offering deeper liquidity than any other market besides CGS.
Although state government issuance has been significant and might continue to outpace HQLA demand over the coming years, it’s worth remembering that between January 2015 and January 2023, banks didn’t even have to buy HQLA due to the existence of the RBA’s Committed Liquidity Facility (CLF). This facility allowed the banks to meet their liquidity requirements through a contractual liquidity commitment from the RBA, collateralised by eligible securities (which was a much broader universe than just HQLA instruments). Despite not having a captive regulatory buyer, semis still saw broad global support and have long been a staple among global reserve managers, especially in Asia.
Global real money will be attracted to the elevated risk premiums and the carry and rolldown potential in such liquid markets. In addition, if European high-grade spread instruments, like French sovereign bonds (the Japanese have often favoured French OATs), are seen as increasingly risky, semis – a similar type of instrument from the perspective of global real money – might be the beneficiaries.
Figure 6: 5-10yr Australian sector credit spreads vs Commonwealth Government Securities (CGS)
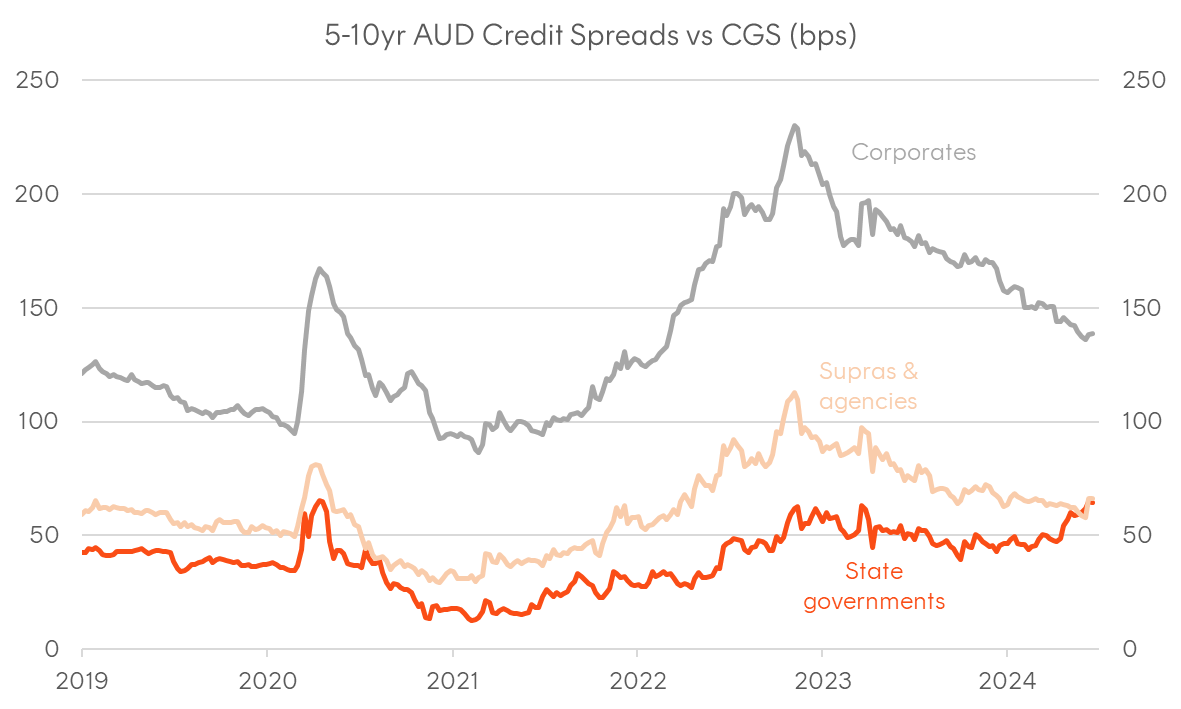
Source: Bloomberg
Figure 7: Australian Commonwealth and statement government yield curves, as at 14-Jun-2024
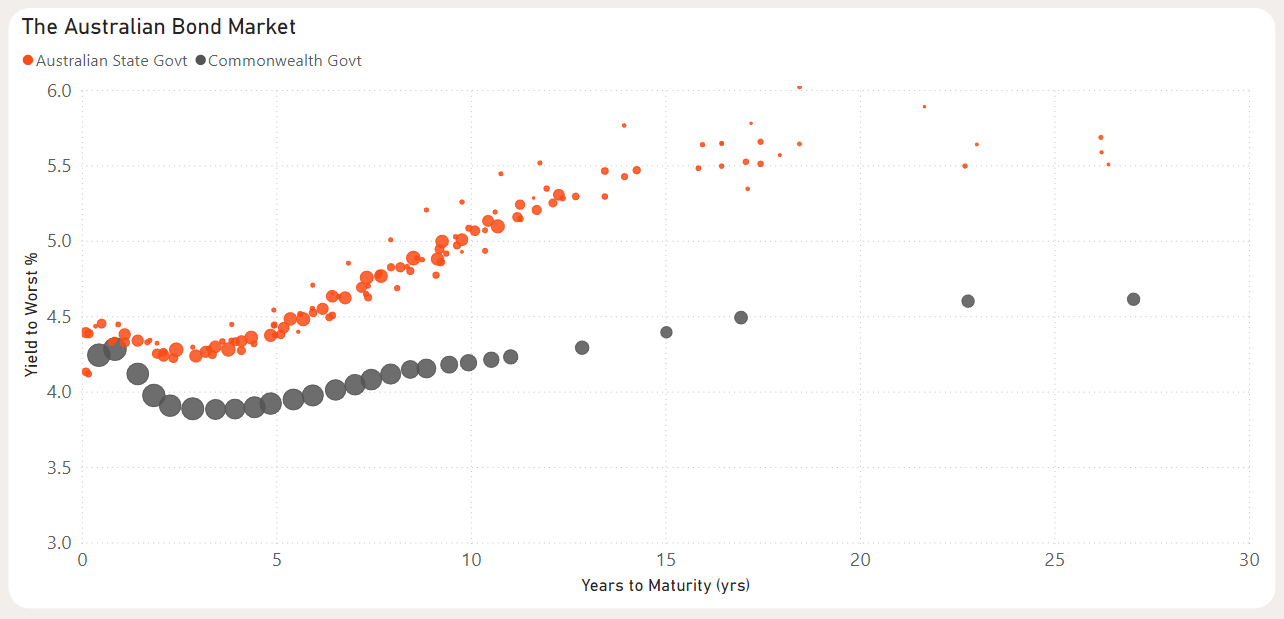
Source: Bloomberg