

David Bassanese
6 minutes reading time
Economy & Central Bank Outlook
- Continued benign US inflation reports and growing expectations that the US Federal Reserve would cut interest rates at the September policy meeting led markets to price in deeper rate cuts in both Australia and the US over August. Fed chair Powell confirmed a likely rate cut at the Jackson Hole symposium late in the month.
- In Australia, the Q2 CPI report was also better than feared, leading the RBA to refrain from raising rates last month. This further supported local expectations for lower official interest rates over the coming year.
- In the US, the market ended the month expecting three 0.25% rate cuts this year and six next year, taking the Fed funds rate from 5.5/5.25% to 3/3.25%. In Australia, there’s around a 70% probability attached to one 0.25% rate cut by year end, with four rate cuts expected by end-2025.

Source: Bloomberg, LSEG, Betashares.
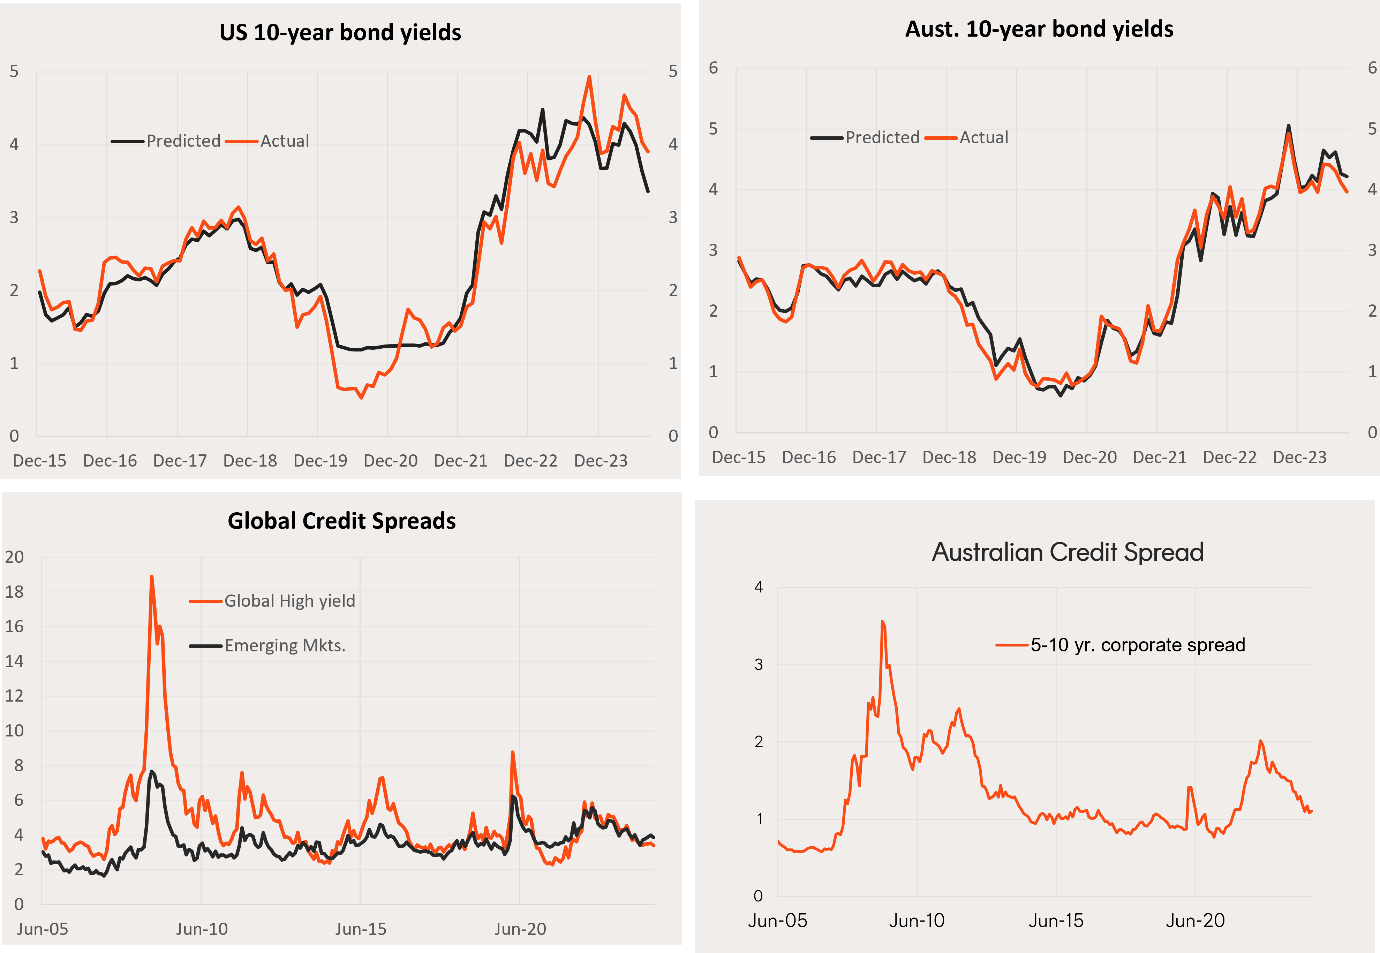
Bond Yields & Credit Spreads
- Reflecting deeper rate-cut expectations, US 10-year bond yields eased further in August, from 4.0% to 3.9%. Australian 10-year bond yields eased from 4.1% to 4.0%. Global and Australian credit spreads continued to narrow last month in line with improving investor optimism and the “soft landing” scenario.
- Given we could be at the early stages of the rate cut cycle, 10-year bond yields should continue to trend lower in coming months, possibly into the 3-3.5% range.
Source: Bloomberg, Betashares. Past performance is not indicative of future performance.
Australian Dollar
- Deeper US rate cut expectations helped boost the Australian dollar over August, which firmed from US 65.4c to US 67.7c. All three fundamental drivers were positive in the month, with the $US softer and the Australian-US 12-month forward expected cash rate differential widening modestly. Iron-ore prices also bounced back a little, from $US 93.8 tonne to $US 94.4.
- According to the Betashares $A model, the $A is trading a little below fair value at US 70c. Despite likely soft iron-ore prices, the $A is expected to gradually strength over coming months, largely due to an anticipated softening in the US dollar.

Source: Bloomberg, LSEG, Betashares.
Global Equities
- Global equities rose further in August, with lower bond yields helping boost PE valuations while forward earnings edged a touch lower. The MSCI All Country World Index returned 1.7% in local currency terms. A stronger $A, however, meant returns in unhedged $A terms fell by 1.3%.
- With global price-to-forward earnings (PE) valuations relatively elevated at 17.9, further market growth likely relies on continued strength in forward earnings. Earnings expectations remains upbeat, consistent with 4% further growth in forward earnings this year and 11% over 2025.

Source: Bloomberg, LSEG, Betashares. Global Equities: MSCI All-Country World Index. Global Bonds: Bloomberg Global Aggregate Bond Index ($A hedged). You cannot invest directly in an index. Past performance is not an indicator of future performance.
Global themes
- The soft landing scenario of good economic growth yet easing inflation and interest has continued to generally favour both financial and growth/technology companies. Gold prices have also so far fared well this year.
- Accordingly, among Betashares global sector/thematic funds, the top three relative momentum* performers as at end-August were gold miners (MNRS), banks (BNKS) and Nasdaq 100 companies (HNDQ).

Source: Bloomberg, LSEG, Betashares. Relative performance indices against the MSCI ACWI in local currency terms. International ETF indices vs. MSCI ACWI Index performance is used to show long term performance of the asset class. Chart shows performance of the index which the relevant ETF aim to track, not the actual past performance of the ETF. *Relative momentum based on the average of 6 and 12 month return performance. **Relative performance for HQUS is against the S&P 500 market-cap weighted return index. Index performance does not take into account ETF fees and costs. ETF may not have been in existence for entire period specified in the chart. You cannot invest directly in an index. Past performance is not an indicator of future performance.
Australian Equities
- Despite a further drop in forward earnings, lower bond yields helped boost Australian equity valuations in August, resulting in a modest 0.5% return for the S&P/ASX 200 Index.
- Downgrades to corporate earnings expectations – and resulting declines in forward earnings – have continued in recent months and are the major reason behind Australia’s relative underperformance to global markets in recent times. Assuming current earnings growth expectations are maintained – which has not been apparent of late – forward earnings would growth a further 1.6% by end-24, and 5.3% growth over 2025 (half that expected of the global benchmark). A major drag on local earnings has been weakness in the energy and materials sector.
- At PE valuation of 17.6, Australian equity valuations are only a little below that of the global benchmark, suggesting Australian equities are not yet relatively cheap.

Source: Bloomberg, LSEG, Betashares. Australian Equities: S&P/ASX 200 Index. Australian Bonds: Bloomberg AusBond Composite Index. You cannot invest directly in an index. Past performance is not an indicator of future performance.
Australian Equity Themes
- Among Betashares sector/thematic Australian equity ETFs, the major trend of late has been underperformance of resources (QRE) relative to financials (QFN).
- In turn, this reflecting a weakening China/iron-ore outlook on the one hand, yet surprisingly good continued bank profit performance despite weak consumer spending and pockets of mortgage stress.
- The relative strength in financials has supported relative performance by the fundamentally-weighted Australian equity ETF (QOZ). Other areas doing well is Australian quality (AQLT).

Source: Bloomberg, LSEG, Betashares. Indices of relative performance versus the S&P/ASX 200 Return Index. Index performance is used to show long term performance of the asset class. Chart shows performance of the index which the relevant ETF aims to track, not the actual past performance of the ETF. Index performance does not take into account ETF fees and costs. You cannot invest directly in an index. ETF may not have been in existence for entire period specified in the chart. Past performance is not an indicator of future performance.