
10 steps to successful investing in 2025 and beyond

Patrick Poke
6 minutes reading time


Better investing starts here
Get Betashares Direct
Betashares Direct is the new investing platform designed to help you build wealth, your way.
Scan the code to download.
Learn more
Learn more
Historically, a small but significant percentage of active managers have outperformed the reference asset class category benchmark each year. According to S&P’s ‘SPIVA Scorecard’, for equity funds, that number was 23% in Australia in 20231, while in the US it was 40%2. But as we look out over longer periods and across all asset classes and categories, a clear trend begins to emerge – the longer the period, the lower the percentage of outperforming active managers.
If active manager outperformance were 100% attributable to skill, we should expect to see the number of outperformers remain fairly consistent across periods. However, if it were luck, we should expect to see the number of outperformers fall over longer periods.
Fortunately, S&P has crunched the numbers for us in their annual ‘Persistence Scorecard’. This follow-up to the more well known SPIVA Scorecard specifically aims to answer the question, “does active manager outperformance persist?” In doing so, it gives us an indication as to whether investment results can be chalked up to luck or skill.
A brief (but important) note on the data
Before getting into the results, it should be noted that the Persistence Scorecard looks at the results of active managers compared to their peers. By contrast, the SPIVA Scorecard compares active manager performance to an index benchmark. Fundamentally, the SPIVA Scorecard and the Persistence Scorecard are seeking to answer different questions.
So, what do the results show?
The data doesn’t seem to paint a pretty picture for skill among active managers. If performance were completely random, we could expect to see ‘persistence’ among 6.25% of outperforming managers – i.e. if a manager outperformed in year one, there’s a 6.25% chance they’d outperform in each of the remaining four years. We can work this out with this simple equation:
50% x 50% x 50% x 50% = 6.25% or 0.54
Australia
In the five years to the end of December 2023, none of the five categories assessed by S&P achieved this 6.25% mark. The Australian Bonds and Australian Equity General categories fared best, but even in these categories, the percentage of persistently outperforming funds was below what we should expect to see if performance were purely random.
Percentage of funds remaining in top half over five consecutive years 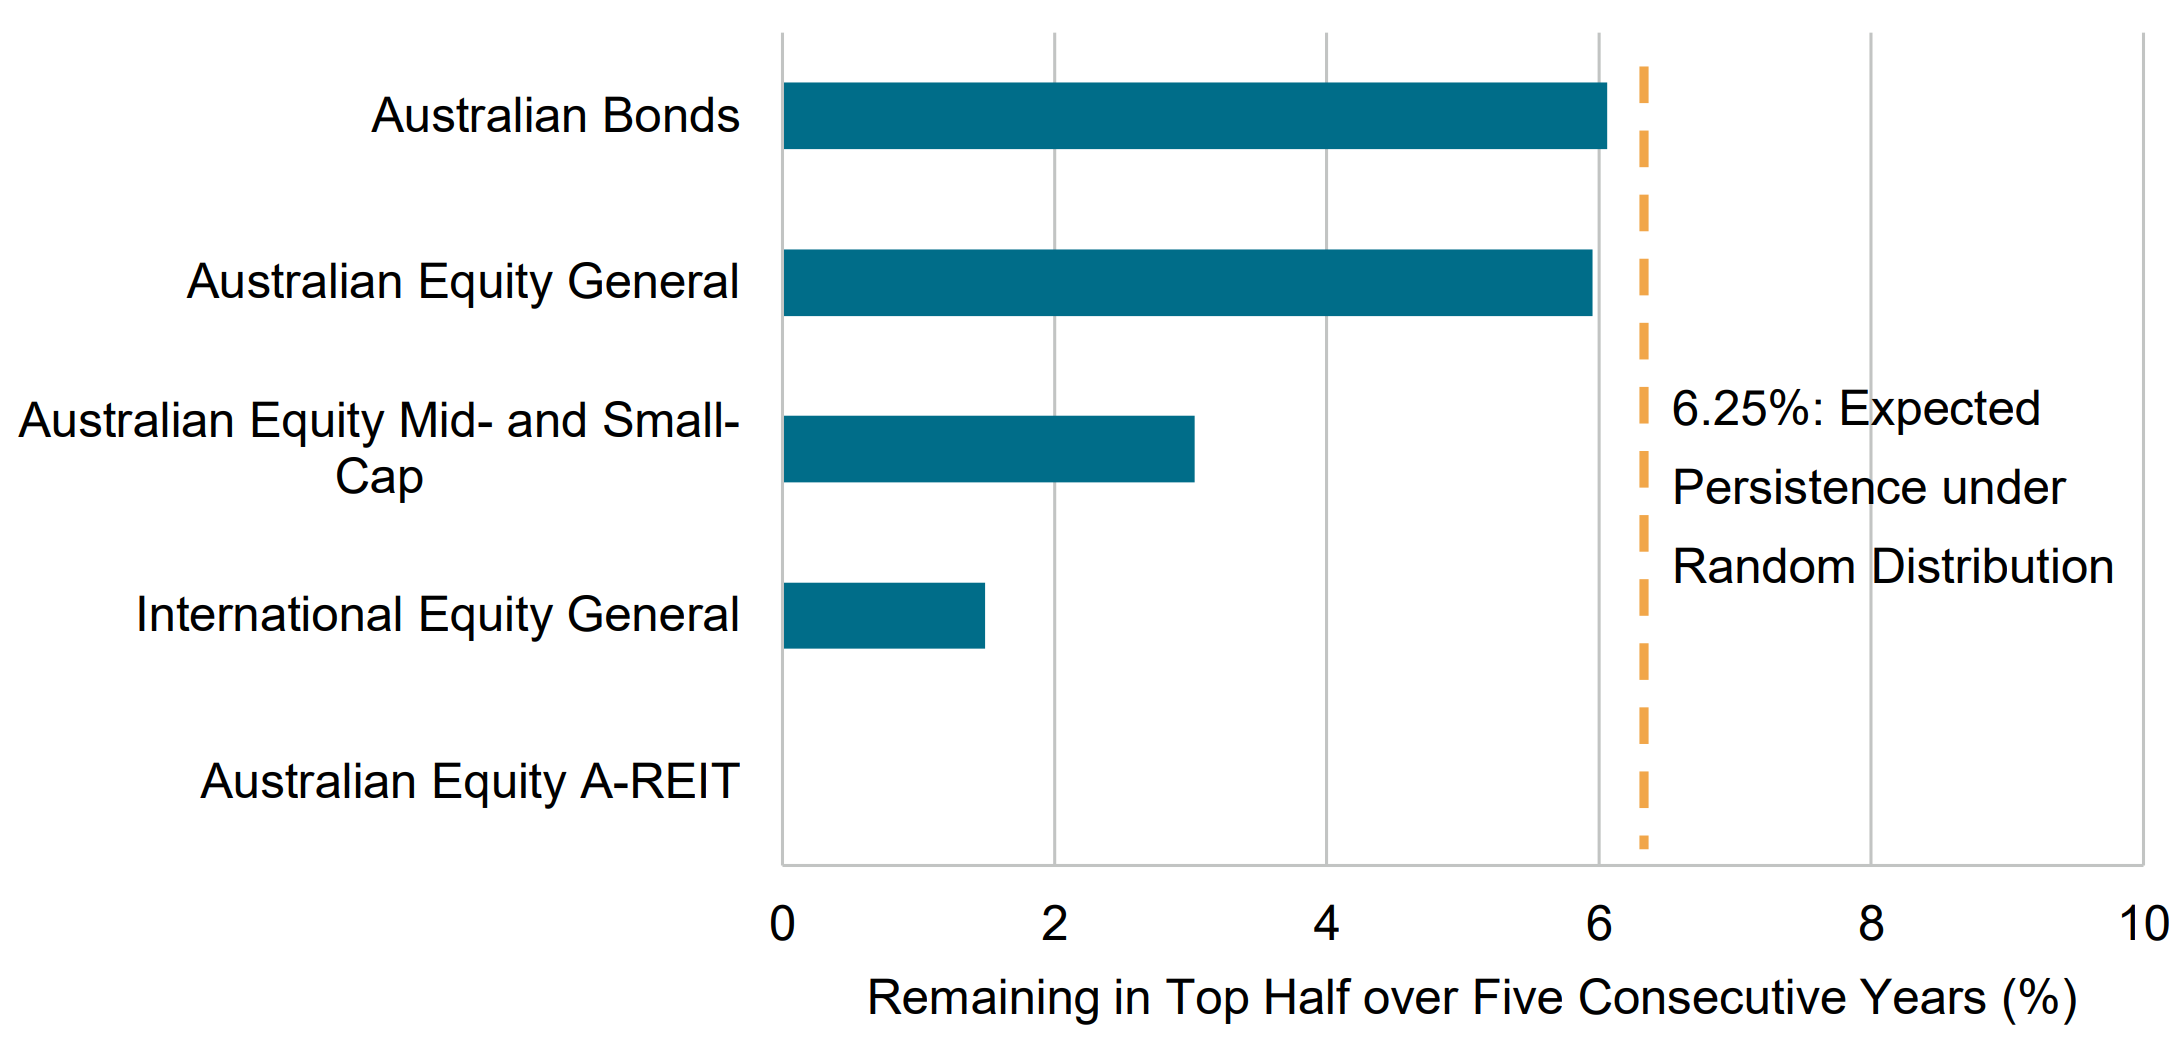
Source: S&P Dow Jones Indices LLC, Morningstar. Data as of 31 December 2023. Chart is provided for illustrative purposes. Past performance is no guarantee of future results.
According to the data, not a single fund in the Australian Equity A-REIT category managed to maintain performance in the top half over the five-year period.
Raising the bar a bit, of the 218 funds in the top quartile in their category at the end of 2019, only a single fund managed to remain in the top quartile over each of the next four years. That’s across all categories.
When measured against the benchmark, the results were even worse. In 2021, 196 out of a total of 329 funds in the Australian Equity General category outperformed the S&P/ASX 200 Index. Only four out of those 196 funds managed to outperform in 2022 and 2023, or just over 2%.
US
Perhaps the US, with its larger economy, markets, and data set will show persistence.
The US Persistence Scorecard only includes equity funds and splits them up into different categories. But the final outcome looks broadly the same.
Only 2% of all large-cap equity funds remained in the top half over a five-year period
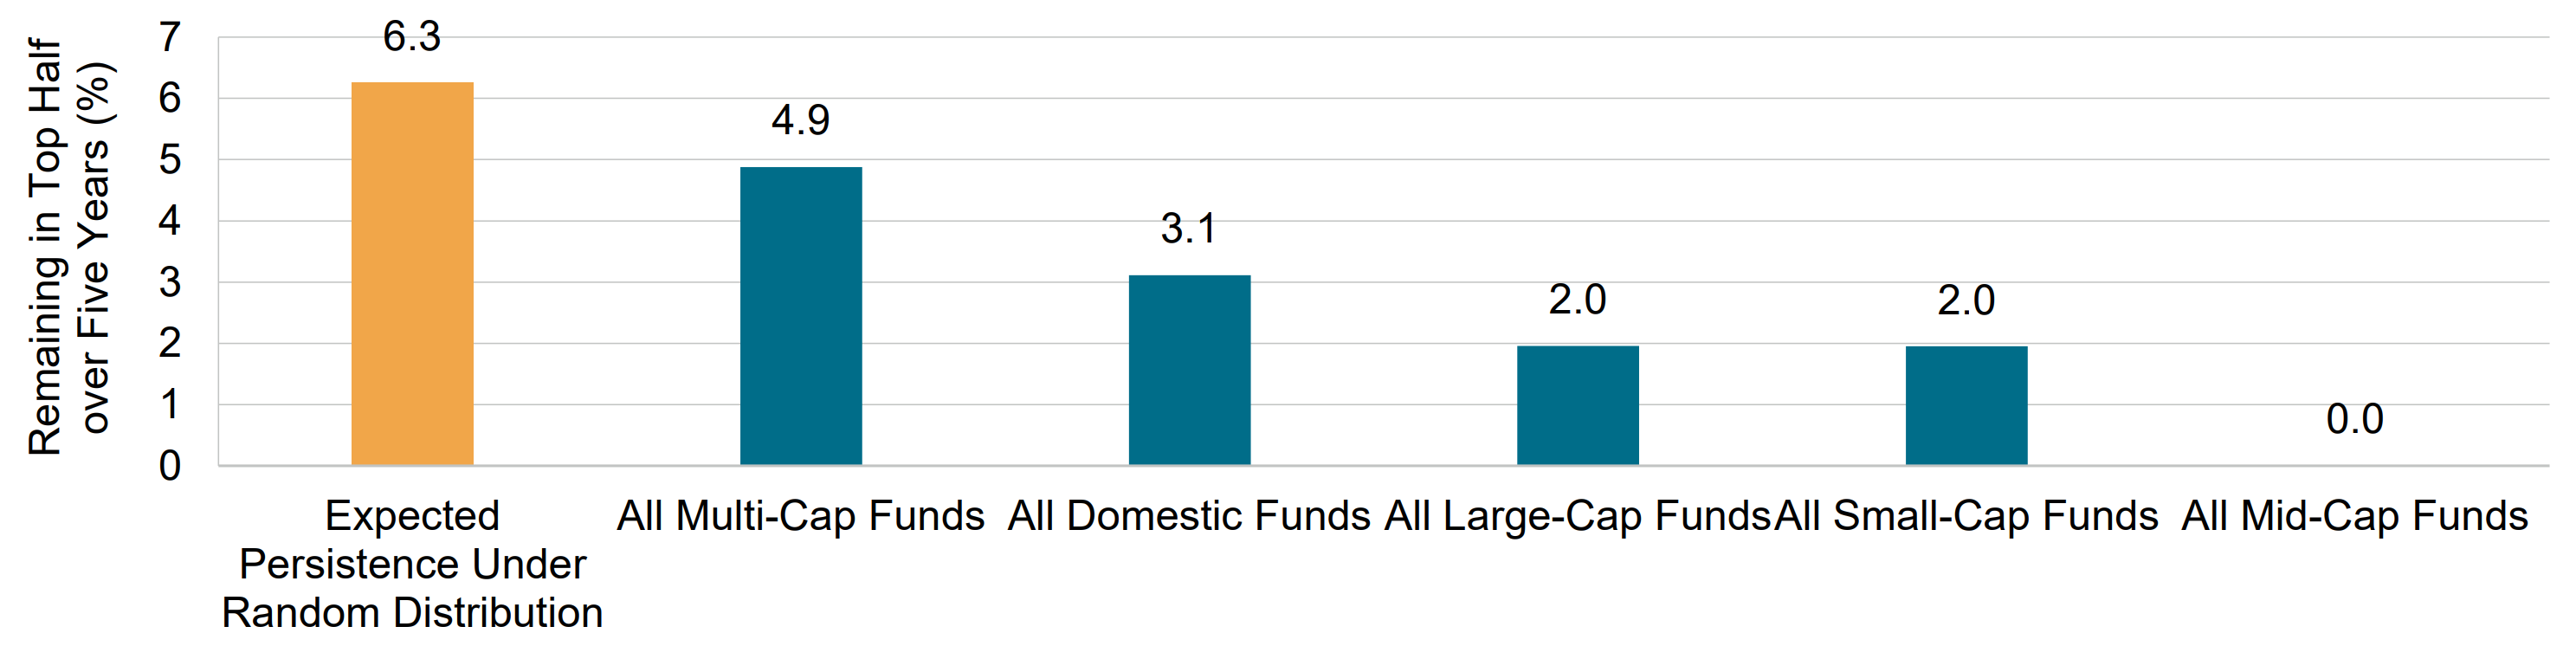
Source: S&P Dow Jones Indices LLC, CRSP. Data as of 31 December 2023. Chart is provided for illustrative purposes. Past performance is no guarantee of future results.
Even with the much larger sample size, not a single fund managed to remain in the top quartile for five consecutive years. In fact, that number had already dropped to zero by the end of year four.
Performance persistence of domestic equity funds over five consecutive 12-month periods
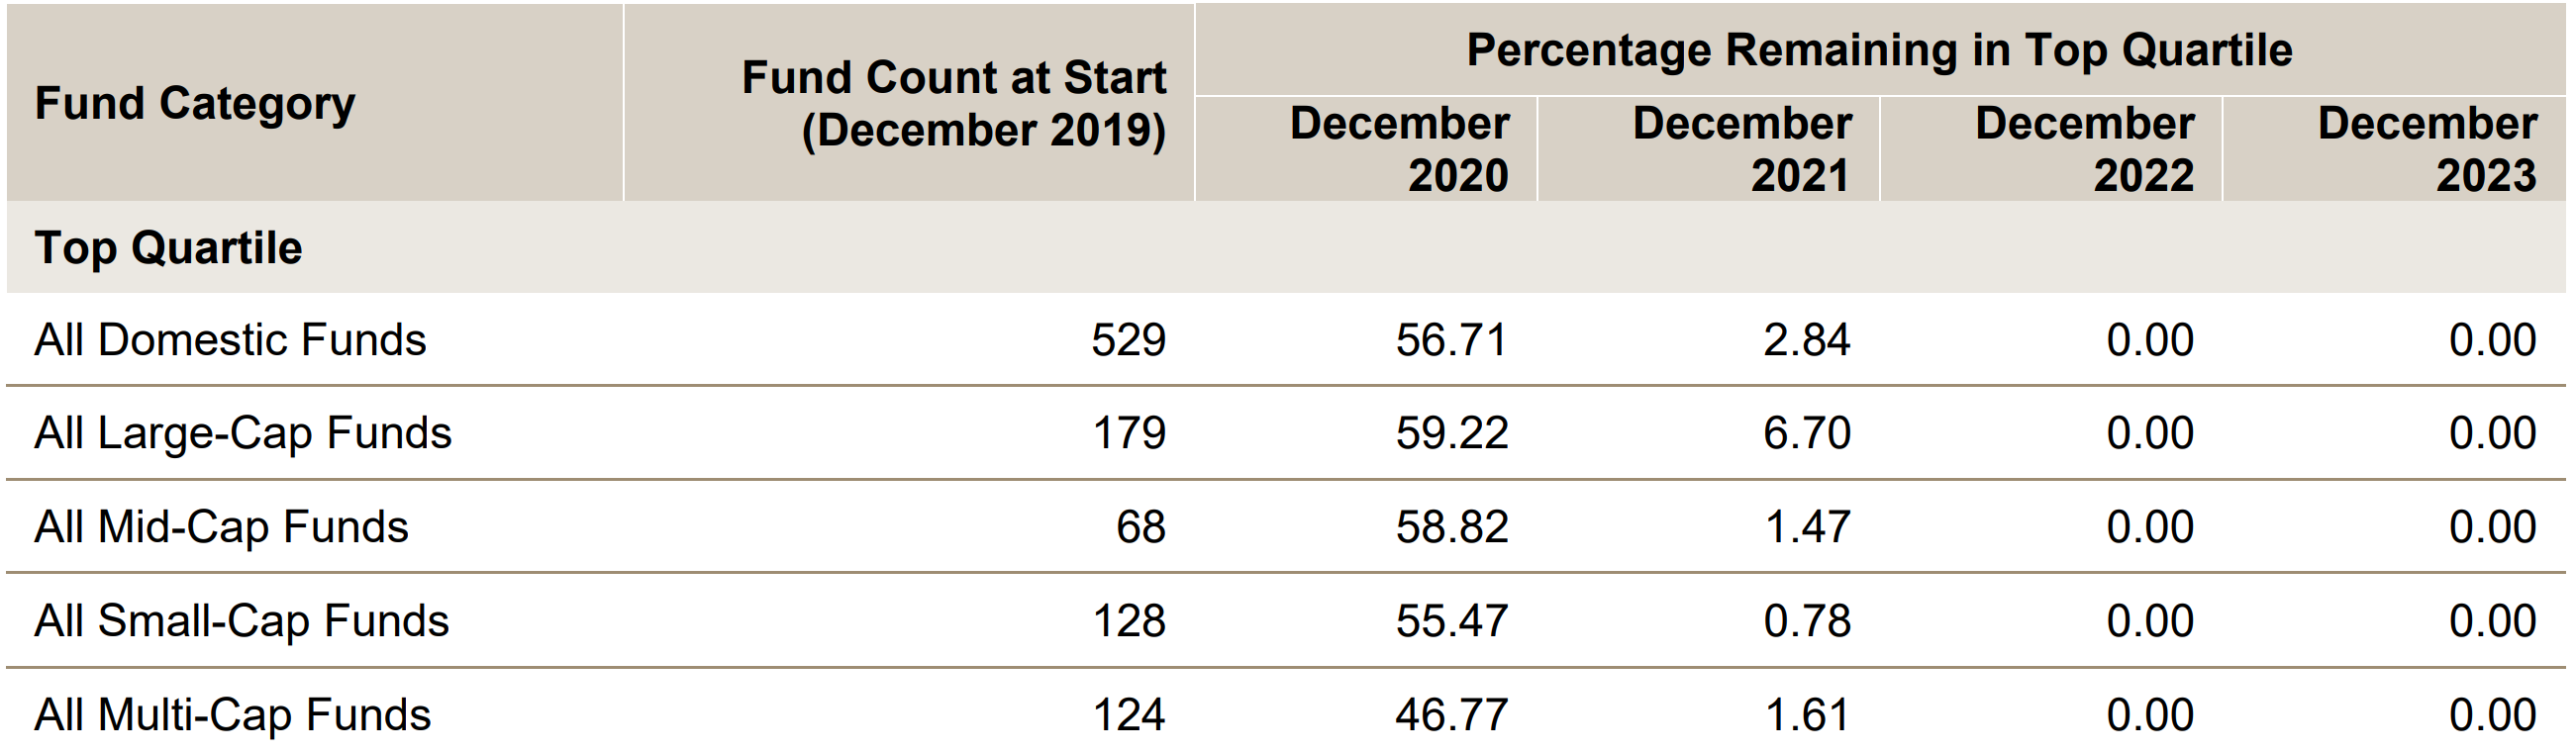
Source: S&P Dow Jones Indices LLC, CRSP. Data as of 31 December 2023. Table is provided for illustrative purposes. Past performance is no guarantee of future results.
The rest of the world
S&P produces this same report for Latin America, Europe, and Canada. Rather than repeating the process and going over the data for each region individually, I’ll cut right to the chase – the story is very similar right across global markets. While there may be occasional bright spots in particular categories, these tend to be based on small sample sizes, short sample periods, or disappear when looking at longer timeframes.
For example, among Euro-Denominated Emerging Markets Equity Funds that achieved top quartile performance in 2021 (of which there were just 83), over 36% remained in the top quartile for the next two years. This is significantly higher than would be expected by random chance alone. Additionally, a similar percentage managed to outperform their benchmark in each of those three years.
However, if we look at the same statistic but start in 2019, just 5% managed to maintain top quartile performance for three consecutive years, and by year four, the number was zero.
Lessons from the scorecard
Despite the size and breadth of the data, there seems to be little to no convincing evidence of persistence in outperformance for active managers. In fact, given that the percentage of funds in the top half or quartile consistently falls well below what would be expected from random chance, one may arguably infer that this is evidence of persistence in underperformance.
Of course, absence of evidence isn’t the same as evidence of absence. But we’ll let readers draw their own conclusions on the question of luck or skill.
The SPIVA Scorecards and Persistence Scorecards for all regions can be found on the S&P Global website.
Sources:
1. S&P Dow Jones Indices. For Australian Equity General Funds. Benchmark is S&P/ASX 200 Index. ↑
2. S&P Dow Jones Indices. For Large-cap US Equity Funds. Benchmark is S&P 500 Index. ↑
Explore
Markets
5 comments on this
As you have detailed in your article, there are very few active managers who can out-perform their benchmark index over any reasonable period of time. The logical conclusion is that investors are much better served by investing in index funds and not contributing to the (often) lavish lifestyles of our grossly under performing active managers. I think that most younger people seem to intuitively get this, but many older investors still invest with “dinosaur” active managers. When these older people go, who will be left to invest with active managers?
The basic conclusions here were published by Vanguard many years back. Marcus Padley would argue that individuals are far more likely to be able to beat the index because they can react much more quickly. I don’t believe that over the long term. The question is: who is right? The buyer or the seller? There are far more people saying they can beat the index than there are listed entities! Beating the index over the long term is a mug’s game in my view.
Too many different opinions and I don’t know who to listen.
Your research outcome is quite correct. Have a read of John C. Noble’s book “The Little Book of Common
Sense Investing” which all “Mum and Dad” investors should buy and read before dipping their toe in the Share Market. Regards Barrie Fox 11.7.2024.
“The Ulysses Contract”, Michael Kemp. Keep it simple, pay low fees, go long.