Betashares Australian ETF Review: November 2024
7 minutes reading time
Risk and return – the two are generally considered to be inseparable.
Want higher returns? You’ll need to take more risk. Want to reduce risk? You’ll have to accept lower returns. Simple enough.
But there may be ways to improve returns without taking on more risk. Don’t believe me? Let’s see how.
Investing efficiently
In a nutshell, it’s all about efficiency. This means reducing fees and costs. By reducing costs, investors can improve their net returns, without needing to take on additional risk.
These can be fixed fees like account keeping fees and brokerage fees, or they can be asset-based fees, charged as a percentage of your investment, such as management costs.
One often overlooked cost is called ‘cash drag’. This is the cost of leaving parts of your money uninvested – i.e. sitting in cash. Depending on where those funds are sitting, you could be earning zero interest, a low interest rate, or a savings account interest rate.
Some investors may choose to hold cash as a way to reduce portfolio volatility, provide flexibility, or cover living costs – this is not what we mean when we say cash drag. Cash drag occurs when you have money that you intend to invest but haven’t made those investments yet.
But surely this won’t make a big impact, I hear you say. Well, while a few dollars or one percent here or there might not seem like big costs, they can really add up over a long period. And when you account for the compounding of returns, the difference can be significant.
Crunching the numbers
Just how significant? Let’s look at some hypothetical scenarios for illustrative purposes.
For the purposes of these projections1, we’ll make the following assumptions:
- Investment timeframe: 40 years
- Investment return: 6% p.a.
- Monthly investment: $1,000
- Starting balance: $0
Scenario 1: Management costs
Management costs, sometimes referred to as an MER (management expense ratio), are usually charged as a percentage of your total investment value – an asset-based fee.
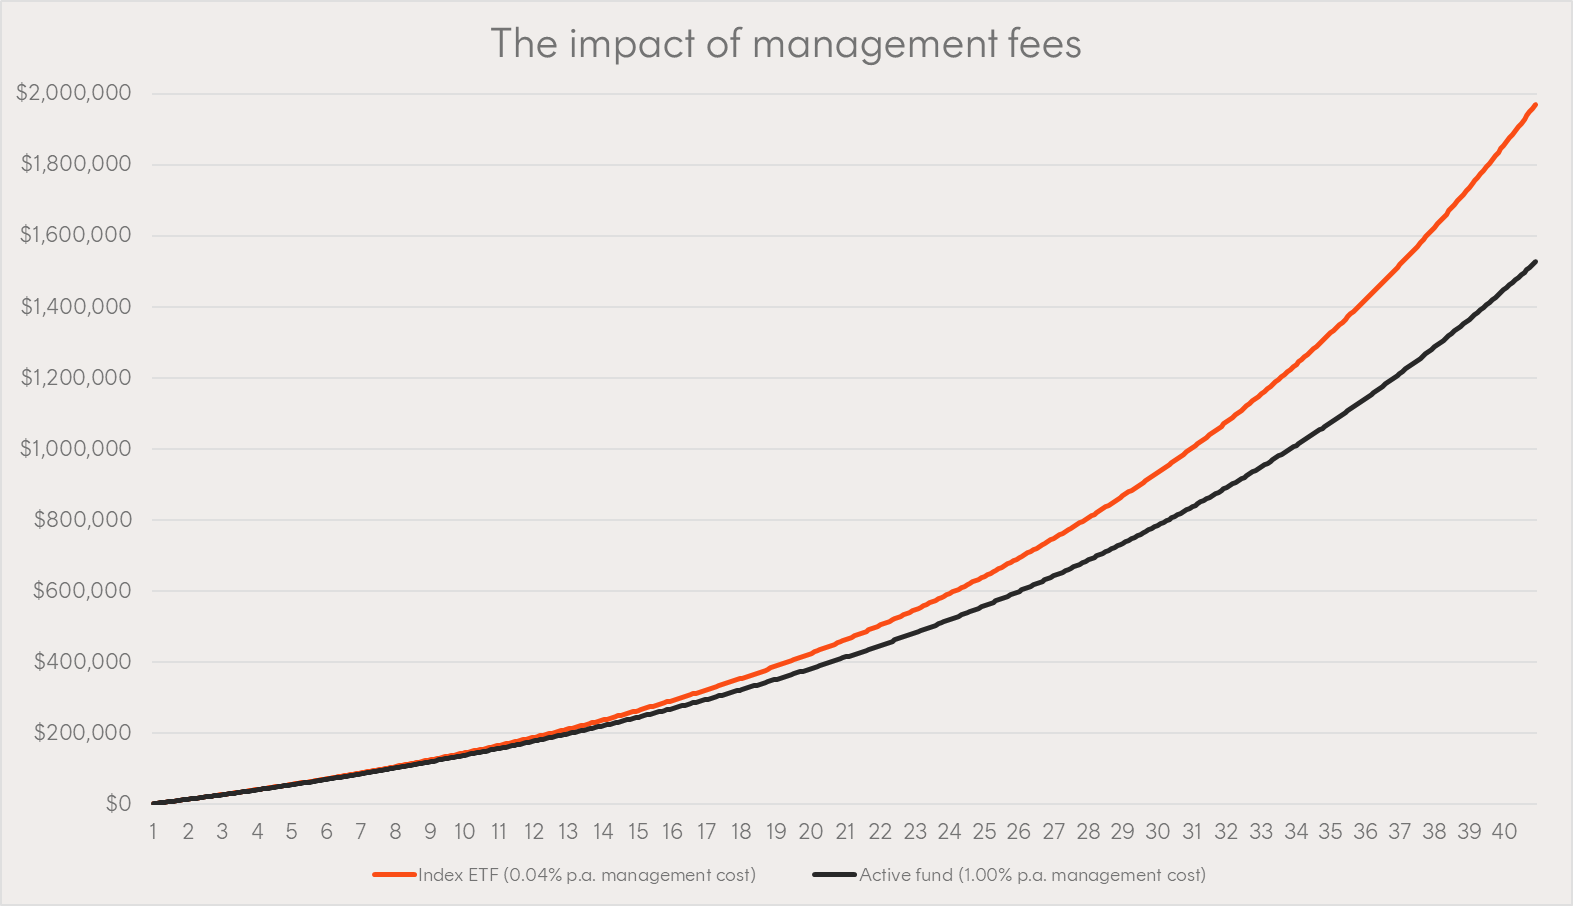
Let’s compare the projected returns for a hypothetical active equity fund with a management cost of 1.00% p.a. to a low-fee broad market-based index ETF charging 0.04% p.a.[2] For the purposes of this example, let’s also assume the risk level associated with the active equity fund is not materially different from the broad market-based index ETF.
Source: Betashares. Hypothetical example provided for illustrative purposes only. Not a recommendation to invest or adopt any investment strategy. Actual results may differ materially.
Over the course of 40 years, that 1.00% p.a. fee can make a significant impact on investment returns. Assuming the return is the same for both funds, the investor paying the higher fee ends up with $1,526,020, while the investor paying the lower fee ends up with $1,970,010. That’s $443,990, or 29% more! Of course, its important to remember management costs aren’t the only factor that impacts returns.
Scenario 2: Brokerage
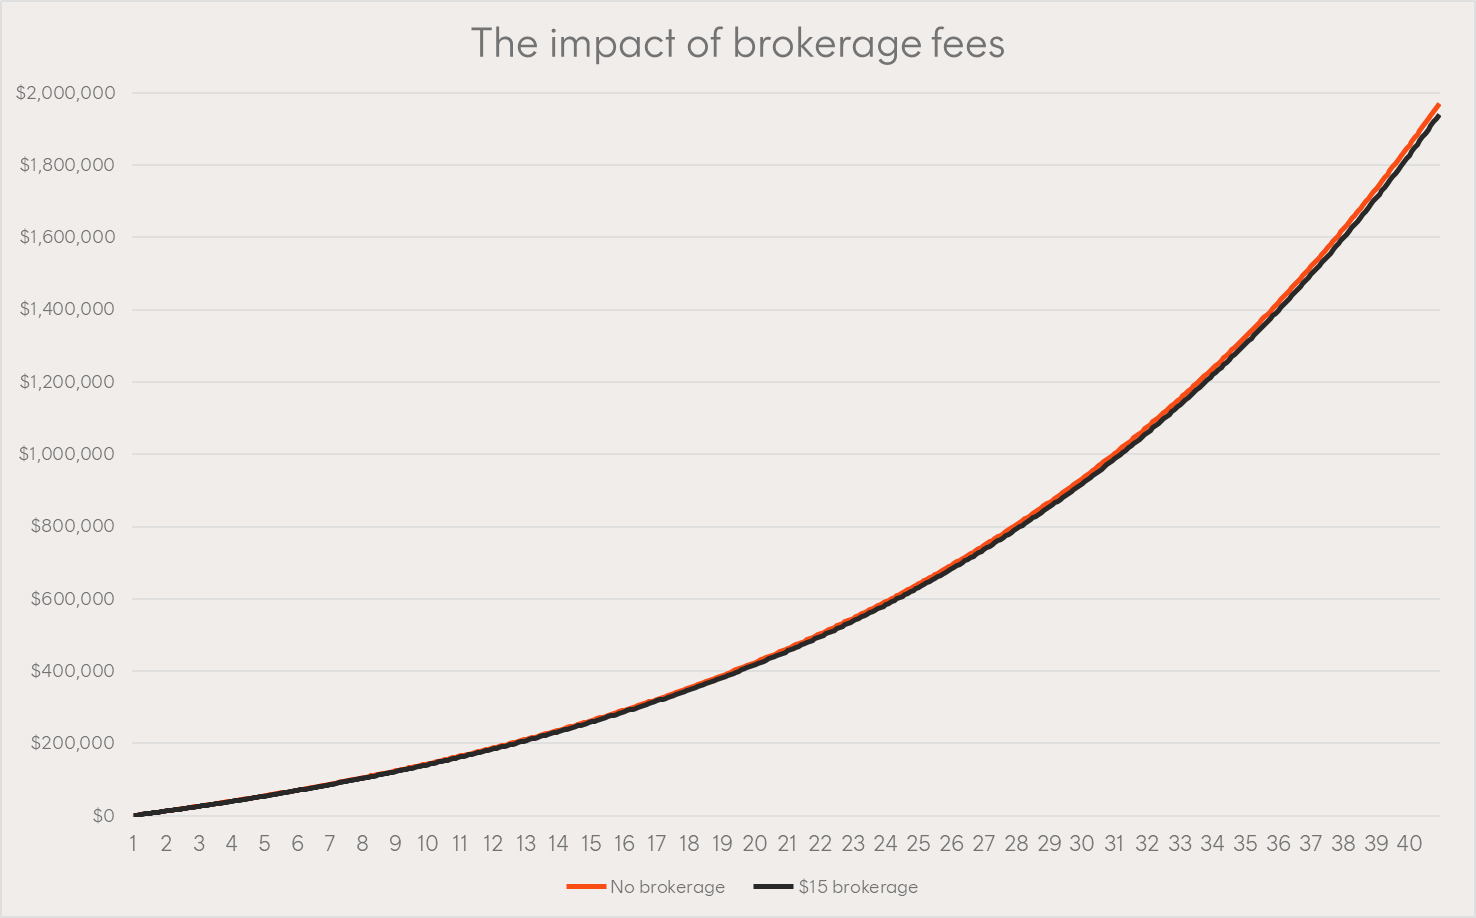
One of the most common direct costs that investors incur is brokerage. According to Canstar, the average brokerage cost in Australia in 2022 for a $1,000 trade was $14.67[3]. For simplicity’s sake, let’s round that up to a fixed cost of $15 per month. For this scenario, we’ll assume we’re paying 0.04% p.a. in management costs.
Source: Betashares. Hypothetical example provided for illustrative purposes only. Not a recommendation to invest or adopt any investment strategy. Actual results may differ materially.
While the chart might not look quite as shocking as the first scenario, we have ending balances of $1,940,460 and $1,970,010. So the investor paying $15 per month in brokerage is $29,550 worse off than the investor who paid no brokerage.
Scenario 3: Cash drag
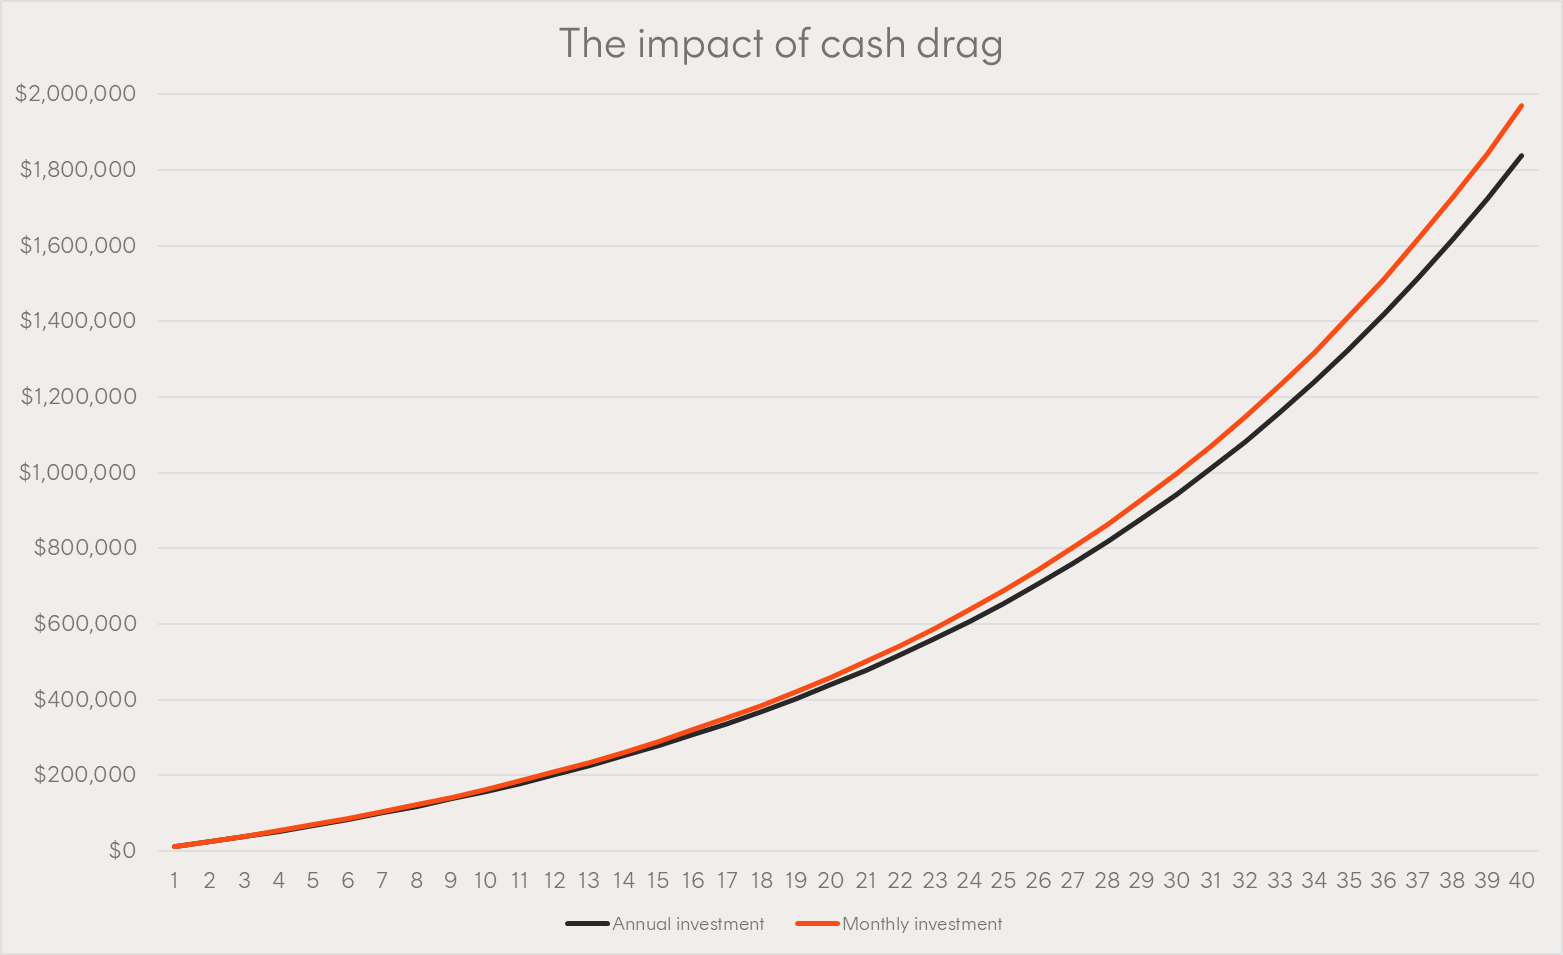
Here’s where it gets really interesting. Let’s consider a situation where, instead of investing $1,000 each month, we save up our cash over the course of a year, earning zero interest, and invest it all at the end of the year.
For the sake of simplicity, we’ll keep all other assumptions the same, and run with the $0 brokerage and 0.04% p.a. management cost. We’ll also assume that we receive no interest on their cash.
We’re comparing this making monthly investments – all other assumptions are the same. Surely, that can’t make a significant difference, right?
Source: Betashares. Hypothetical example provided for illustrative purposes only. Not a recommendation to invest or adopt any investment strategy. Actual results may differ materially.
The annual investor ends up with $1,838,577 at the end of year 40, while the monthly investor ends up with $1,970,010. Investing monthly resulted in a balance that was $131,433, or 7.1% higher.
Another source of cash drag can be residuals left over from needing to purchase whole units in an ETF, or whole shares. For example, if you had $1,000 to invest, but wanted to buy an ETF with a price of $105, you’d be left with $55 sitting in cash. This can happen when making investments, or due to participation in distribution reinvestment programs (DRPs).
Scenario 4: Compounding on compounding
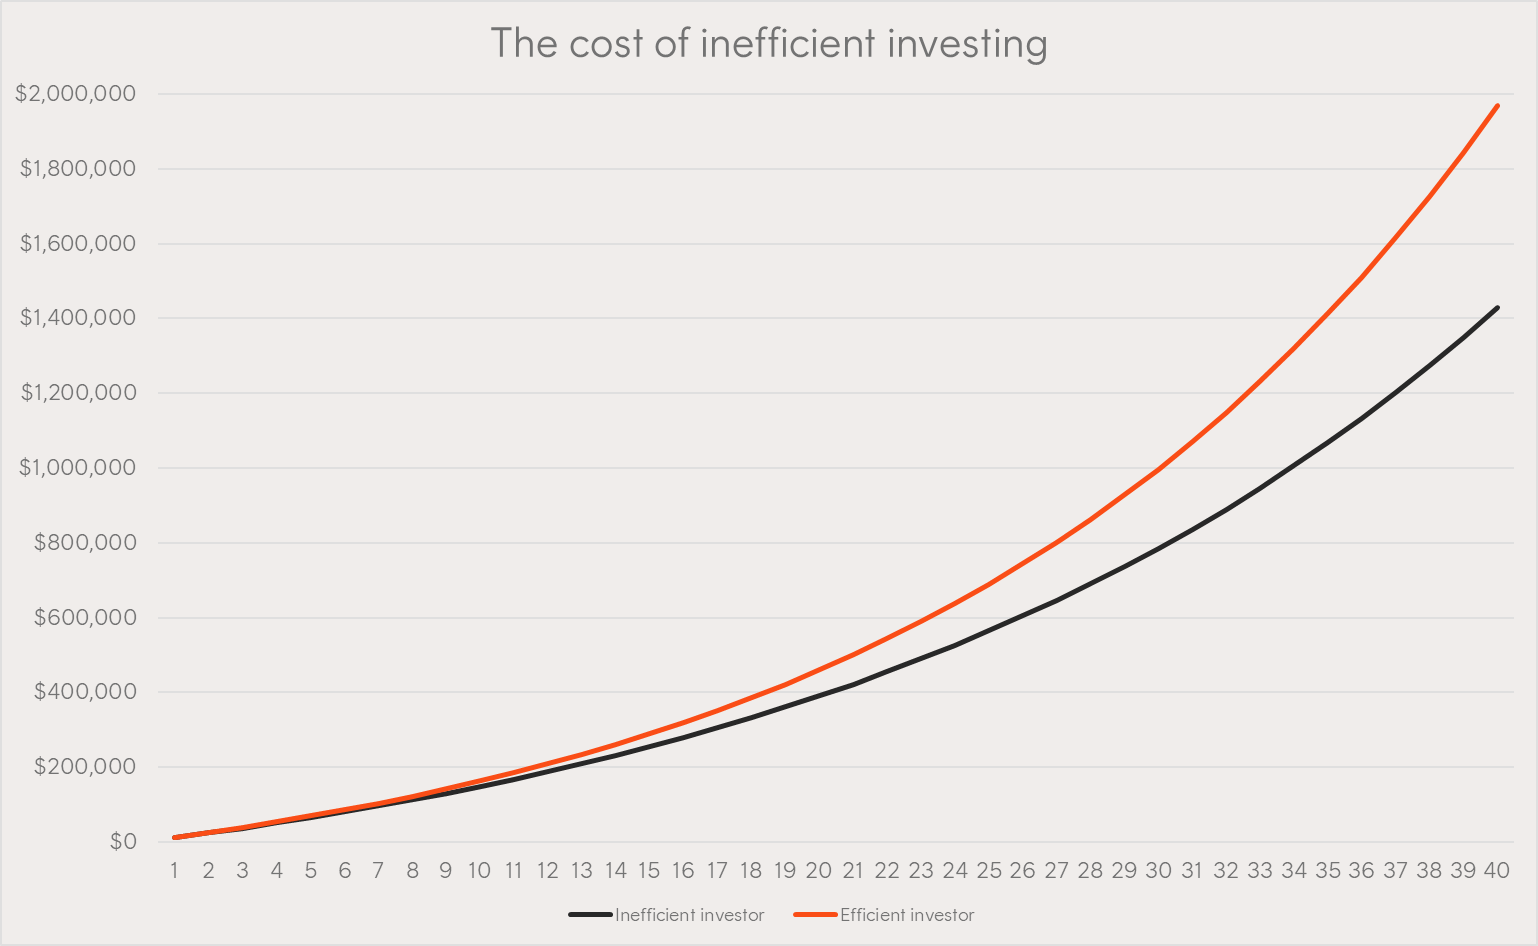
Finally, let’s see what happens when we add all these effects together. Our ‘inefficient investor’ will pay both fees discussed above – $15 per month (which for simplicity we will refer to as an ‘account keeping fee’ in this example) and a management cost of 1.00% p.a. – plus they’ll make annual contributions to their investment (rather than doing so monthly).
We’ll compare this to an ‘efficient investor’ paying no monthly ‘account keeping fee’, a 0.04% p.a. management cost in relation to their investment and making monthly contributions to their investment.
Source: Betashares. Hypothetical example provided for illustrative purposes only. Not a recommendation to invest or adopt any investment strategy. Actual results may differ materially.
The difference here is hard to ignore. The inefficient investor ends up with $1,427,853, while the efficient investor ends up with $1,970,010 – an extra $542,157, or 38%. And all we did was save money on account-keeping fees and management costs, as well as investing more regularly.
Efficiency in practice
While the above scenarios are hypothetical, it is possible to invest with lower management costs, no brokerage fees, and no account keeping fees. And with no brokerage fees, it’s easy and frictionless to invest as often as your situation allows.
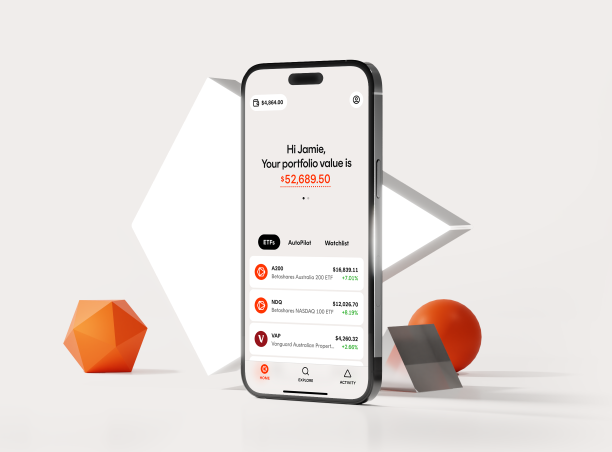
Betashares recently launched our new investing platform, Betashares Direct, which allows investors to buy ETFs traded on Australian exchanges with zero brokerage and no account fees. Betashares Direct also offers fractional investments in ETFs, helping to reduce residual cash holdings and increase efficiency, as well as an AutoPilot feature that allows you to set up automated, recurring investments.
And with a broad range of low cost ETFs available on the ASX, it’s easy to keep costs low when building a diversified portfolio.
Refer to the Product Disclosure Statement for information on interest retained by Betashares on cash balances and portfolio fees associated with AutoPilot portfolios.
References:
1. All projections in this article are in nominal and not real terms, i.e. they have not been increased to account for inflation.
2. Based on the management cost for Betashares Australia 200 ETF (ASX: A200).
3. Source: Canstar. Brokerage fees Australia: What is a brokerage fee?


5 comments on this
I am heavily invested in Betashares ETF’s. I hope you are correct as I will be 110 years old and super rich, alas, but I think I may be ashes by then. Also giving that any of our ETF is not wound up by then. There are so many variables to consider which makes your proposition somewhat of a sophisticated marketing tool.
Hi Silvio,
Thanks for your comment.
The examples shown are supposed to be illustrative, and the principles apply regardless of your investment timeframe – though of course, the longer your investment timeframe, the greater the effect.
We try to write content to appeal to a wide range of people, and a significant portion of our audience is under 35, so a 40 year investment timeframe is realistic for many people.
You’re absolutely correct that there are many other variables to consider. These examples are just supposed to be illustrative, so I made an effort to isolate the variables discussed so readers could see the impact of these specific items.
Cheers,
Patrick
Hi Patrick,
Everyone talking about compounding interest but with 100’s of ETF in Betashares, how one can recognise which investment offer the compounding interest for long term investment. This is something i couldn’t able to find out anywhere in the website. Please advise.
Hi Visu,
Predicting which ETF will have the best long term returns is difficult, if not impossible. That’s why building a broadly diversified portfolio that aligns with your risk tolerance is important. And it’s always a good idea to seek professional advice from a licenced adviser.
It’s also important to consider that different ETFs have different strategies and goals. Some ETFs might be optimised for income, and may achieve lower absolute returns. Others might be suited for long term growth, or for managing risk or volatility. The Target Market Determination (TMD) and Product Disclosure Statement (PDS) are useful resources to help investors understand these factors and ensure the ETF they’re investing in aligns with their risk tolerance and goals. These are available from the “Resources” section of each ETF’s fund page.
Regards,
Patrick
thanks for info.