Charts of the month: March 2025
12 minutes reading time
Global macro and rates
Global developments
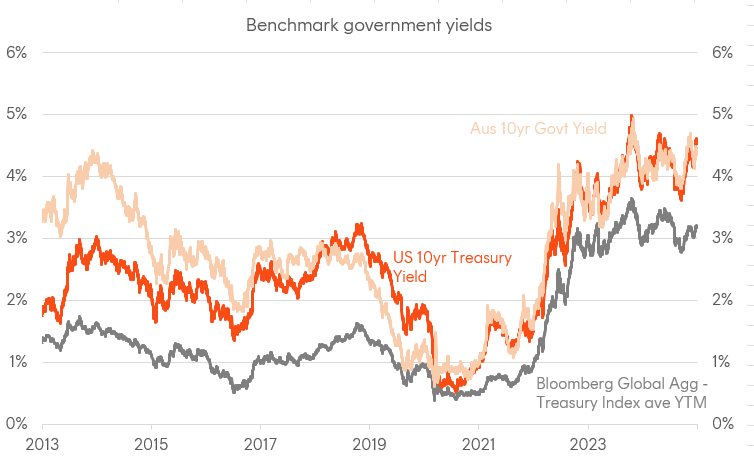
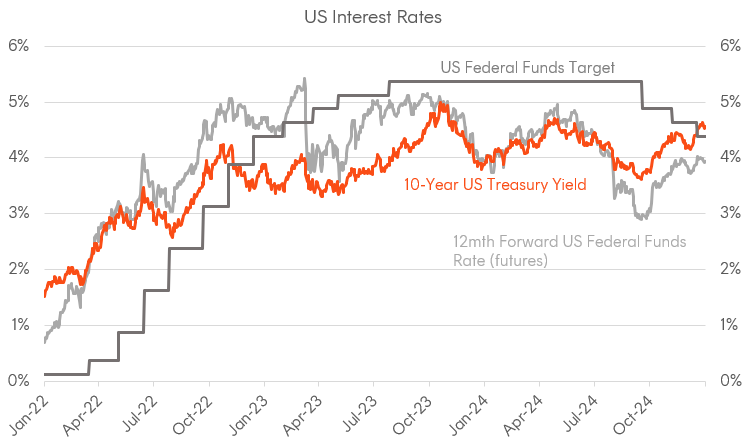
Global bond yields rose modestly in Q4 2024 despite central banks undertaking further rate cuts, as concerns over deficits, stronger-than-expected US data and policy uncertainty weighed. This quarter also featured some of the defining political moments of the year: the US election, a French government no-confidence vote, and a short-lived martial law declaration in Korea. The Bloomberg Global Treasury Index yield increased by 33 basis points, led by US Treasury movements. Notably, the US 10-year Treasury yield climbed by 79 basis points to 4.57%, with the entire yield curve fully normalising and the spread between 10-year and 2-year Treasuries reaching its steepest level since 2022.
In the US, the Federal Reserve implemented two 25-basis-point rate cuts in November and December, with a hawkish tone appearing during the latter meeting amid better-than-expected economic data. Chair Powell reiterated a data-dependent approach, while the median FOMC member in the latest “dot plot” projected only two rate cuts for 2025—down from four expected in September. Additionally, the long-run Fed funds rate estimate was raised slightly, interpreted by markets as an upward revision to the so-called “neutral rate.” Heightened fiscal concerns, expectations of sustained high budget deficits under President-elect Trump, and speculation over potential tariffs and tax cuts added further upward pressure on yields.
Other major central banks made notable progress on rate cuts. The ECB cut its key policy rates by 25 basis points in both October and December, while adopting a cautious, data-dependent stance. The Bank of Canada also lowered rates twice, each by 50 basis points, prioritising economic growth amid sluggish conditions and low inflation. The Bank of England made a single 25 basis point cut in November, although held rates steady in December amid a relatively expansionary autumn budget, which also put pressure on gilts. The Bank of Japan kept a hawkish bias throughout the quarter, although left rates unchanged in December and is still the major outlier in the current global easing cycle.
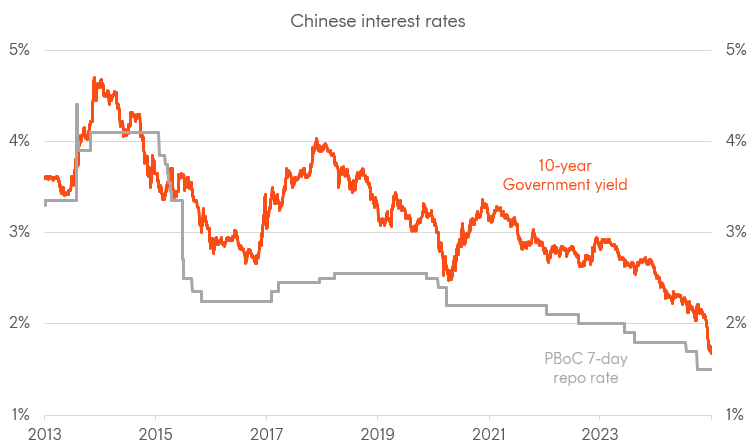
China’s policy announcement of fiscal stimulus and cut of the key repo rate sparked optimism heading into Q4, temporarily lifting government bond yields. However, concerns over policy implementation resurfaced, driving yields back down to end the year below 1.7%, a fresh all-time low. Notably, the Chinese 30-year government bond yield traded below the Japanese equivalent for the first time, underscoring the challenges faced by China’s economy in sustaining long-term growth.
Domestic developments
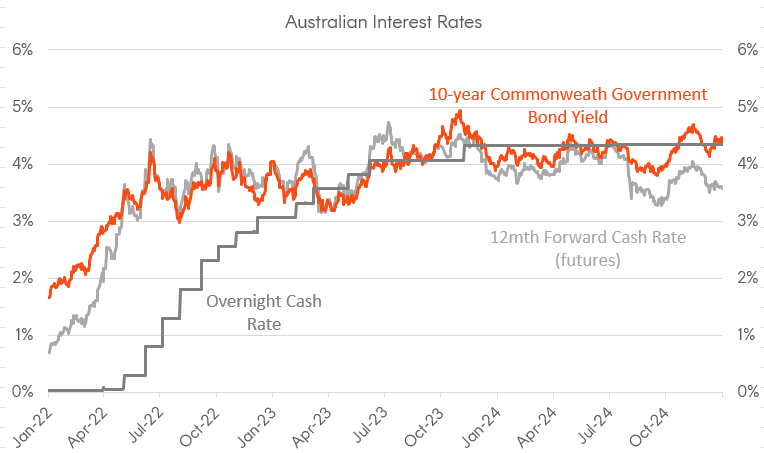
Australian government bond yields rose, but to a lesser extent than US Treasuries, driven by relatively soft domestic economic conditions and a more dovish outlook from the RBA. Over Q4, the 10-year Australian Commonwealth government yield rose 0.39% to 4.36%, ending the period below 10-year US Treasury yields. This divergence accelerated in December, following a dovish pivot from the RBA and the hawkish December FOMC. Market watchers saw this as being generally consistent with continued “US exceptionalism” and an US economy that continues to surprise to the upside; while the Australian economy (like many other developed economies) continues to show signs of slowing growth, as Chinese weakness adds additional drag.
Although the RBA held the cash rate target at 4.35% at both the November and December meetings, it signalled a shift towards potential rate cuts. This was clear in changes to the RBA’s December statement and Governor Bullock’s comments during the accompanying press conference. In the December statement, the previously hawkish language, such as “…policy will need to be sufficiently restrictive…”, was replaced with a more dovish tone, including phrases like “…the Board is gaining some confidence that inflation is moving sustainably towards target.” Market pricing for a February 2025 rate cut increased, with the probability rising to nearly 70% by year-end. However, most economists continue to expect the first RBA rate cut to occur in May.
Credit Markets
Global credit
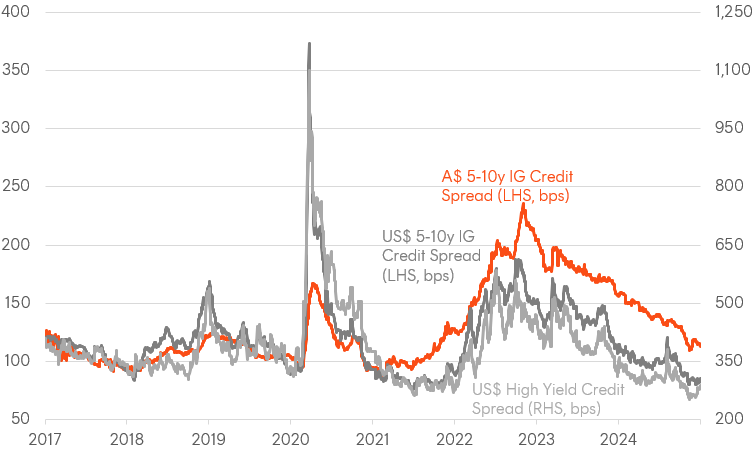
Global credit markets remained resilient during the December quarter, despite elevated policy uncertainty and volatile government yields. Investment-grade credit spreads in the US narrowed by 11 basis points to 85 basis points over US Treasuries, approaching record lows, with investment-grade issuers raised $4 trillion in 2024, marking the highest annual total since 2021. High-yield spreads tightened by 12 basis points, driven by diminishing recession risks and strong investor demand for attractive yields.
In Europe, political tensions had a limited impact on broader credit markets, although brought Eurozone sovereign spreads back into focus briefly. A contentious French budget debate led to the government’s dissolution following a no-confidence vote, which was soon followed by Moody’s downgrading France’s sovereign credit rating. This brought Moody’s rating in line with S&P, which had downgraded France to AA– earlier in the year. French 10-year spreads widened to 88 basis points above German Bunds and, for the first time, traded above Spanish spreads. This also triggered a broader widening in spreads for French financials. However, the spillover effect beyond French issuers was largely contained.
Domestic credit
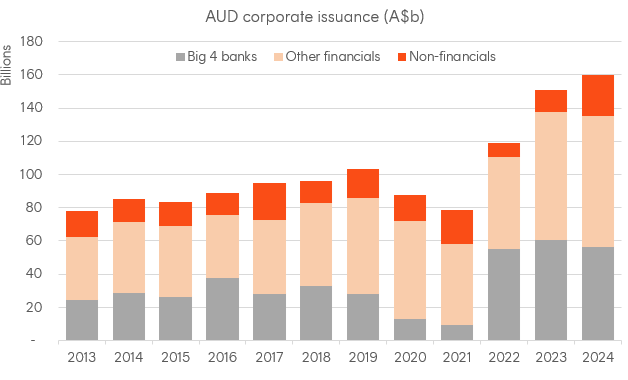
Australia’s credit market followed similar trends, with investment-grade spreads compressing by 15 basis points in Q4 to 114 basis points over government yields. Corporate (ex-financial) issuance reached a record A$24.27 billion in 2024, an 89% increase from 2023. Including financials, total fixed-rate credit issuance surpassed A$159 billion, while aggregate issuance across financials, corporates, government-related entities reached a record A$247 billion. A clear bias toward longer tenors (7+ years) was clear, with these maturities accounting for 68% of total 2024 corporate issuance. The Australian credit market’s growing size, depth, and diversification, coupled with its competitive AUD pricing after swaps, have led to multiple inaugural issuances such as Nestle and Qube, with more global issuers now viewing the AUD market as a key issuance venue.
A significant development for the local credit market was APRA’s decision to officially phase out bank-issued Additional Tier 1 (AT1) capital instruments, commonly known as “hybrids.” This decision, formalised in December after a two-month consultation process, followed a proposal and discussion paper released in September. Under the new framework, AT1 instruments will remain eligible as regulatory capital until their first call dates. From 2027, they will be treated as equivalent to Tier 2 (T2) capital until they are fully phased out by 2032, which marks the final first call date for outstanding hybrids.
APRA has provided a detailed timeline for the transition, including a consultation period on prudential and reporting standards in mid-2025 and the finalisation of new standards by late 2025. The move aims to enhance the banking sector’s resilience by simplifying capital structures, reflecting lessons from the global banking turbulence of early 2023. Large banks are expected to adopt a mix of T2 and common equity instruments, while smaller banks may rely solely on T2 issuance. This shift is expected to result in approximately A$36 billion in new T2 issuance over the next seven years. Insurers are not affected by this change and can continue to issue AT1 securities.
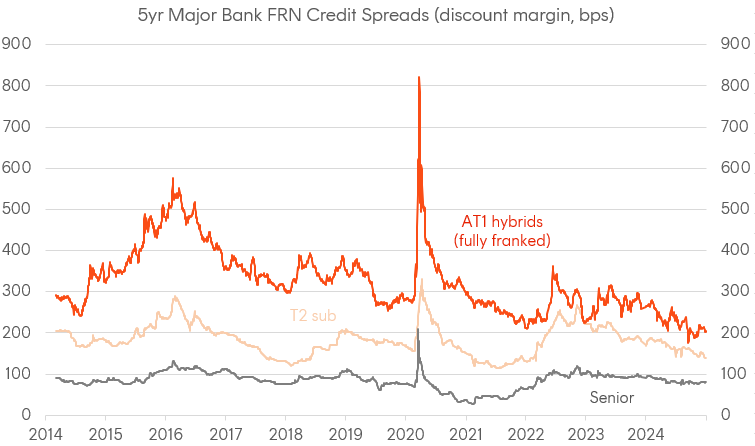
APRA’s decision to phase out bank hybrids has drawn mixed reactions, particularly from retail investors and financial advisers who have traditionally valued these instruments for their steady income and franking credits. Concerns have been raised about the reduced availability of such investments and the need to find suitable alternatives. Initially, hybrid spreads tightened as the market perceived that the risk of “non-call” had effectively been eliminated. At the same time, Tier 2 spreads widened marginally on expectations of increased issuance. However, this was short-lived, and by the end of the period, both AT1 and Tier 2 spreads had normalised, wither 5-year major bank T2 discount margins ending the period broadly at the midpoint between AT1 and senior equivalents, with the latter largely drifting sideways over the quarter.
Outlook
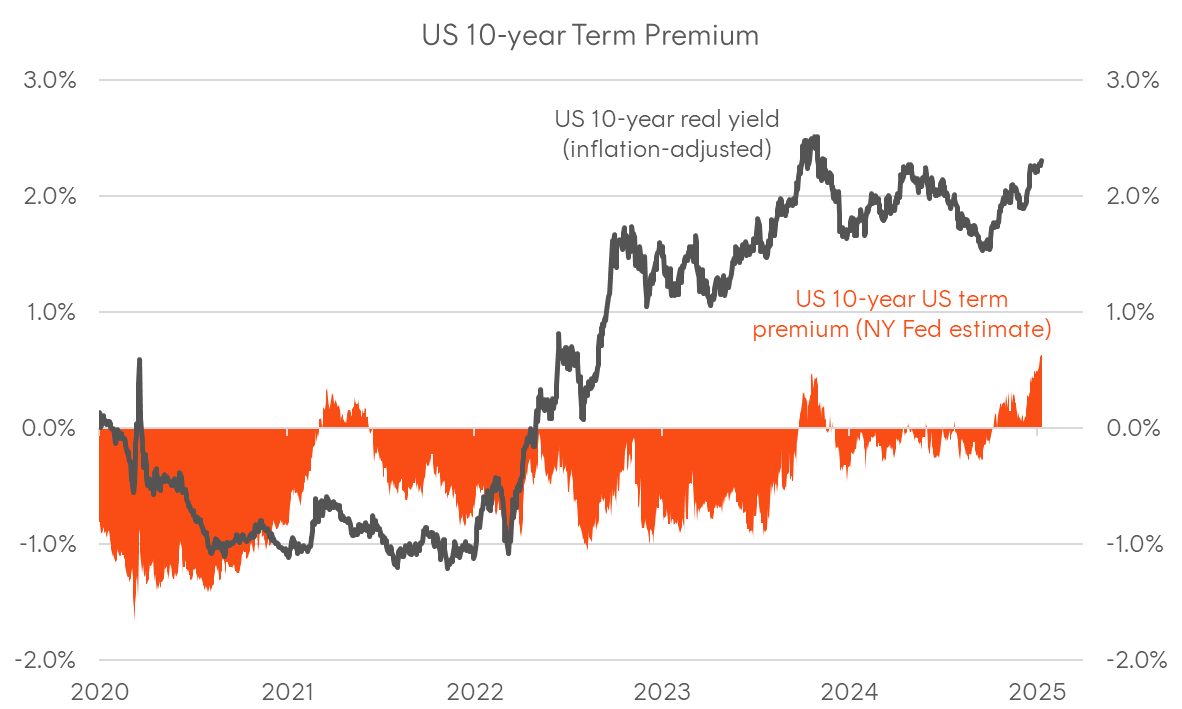
As we enter 2025, the surge in bond yields has become a defining feature of global markets. Since mid-September, the 10-year US Treasury yield has risen by 100 basis points—a remarkable move, given that the Federal Reserve cut rates by the same magnitude during this period. Historically, this is a highly unusual development and highlights the growing influence of fiscal concerns, coinciding with the most common measures of term premia reaching their highest levels in years. Additionally, lingering doubts about the ability of traditional fixed income to effectively hedge equity risk in portfolios may also be a contributing factor, with stock-bond correlations fluctuating between positive and negative territory depending on the macroeconomic narrative.
It is worth noting that traditional fixed income, more than other asset classes, structurally embeds mean reversion in returns. Higher yields may lead to drawdowns in the short term, but they also improve forward-looking return expectations. A bear steepening trend and higher term premia raise the expected excess returns compared to cash and short-duration equivalents. In addition, real yields above 2%—as seen in both Australian and US 10-year government bonds— effectively guarantee positive real returns on inflation-linked bonds and imply a high likelihood of nominal bonds beating inflation over the typical strategic asset allocation horizon.
The fact that 10-year US Treasury yields have risen for four consecutive calendar years (with Australian 10-year yields largely moving in lockstep) should not be seen as negative for bond investors. On the contrary, this trend arguably makes long-duration government bonds less risky now due to higher expected returns, greater capital upside in the event of a major global growth scare, and enhanced portfolio diversification potential.
Chart 1: G7 + Australasia Policy Rates
|
Country |
Sep-24 |
Dec-24 |
Dec-25 implied rate |
Expected rate change over 2025 |
|
United States |
4.875% |
4.375% |
3.944% |
-0.431% |
|
Euro Zone |
3.500% |
3.000% |
1.842% |
-1.158% |
|
Japan |
0.250% |
0.250% |
0.742% |
+0.492% |
|
United Kingdom |
5.000% |
4.750% |
4.157% |
-0.593% |
|
Canada |
4.250% |
3.250% |
2.583% |
-0.667% |
|
Australia |
4.350% |
4.350% |
3.541% |
-0.809% |
|
New Zealand |
5.250% |
4.250% |
2.997% |
-1.253% |
Source: Bloomberg as at 31 December 2024. Implied forward rates from futures or overnight indexed swaps.
Chart 2: 10-year Government bond yields
Source: Bloomberg, as at 31 December 2024.
Chart 3: Chinese benchmark interest rates
Source: Bloomberg, as at 31 December 2024.
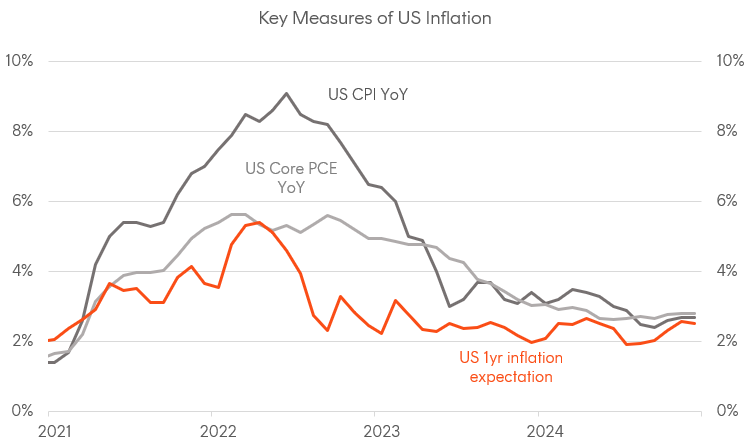
Chart 4: Measures of US inflation; 1-year expectations inferred from inflation swaps.
Source: BLS, Bloomberg
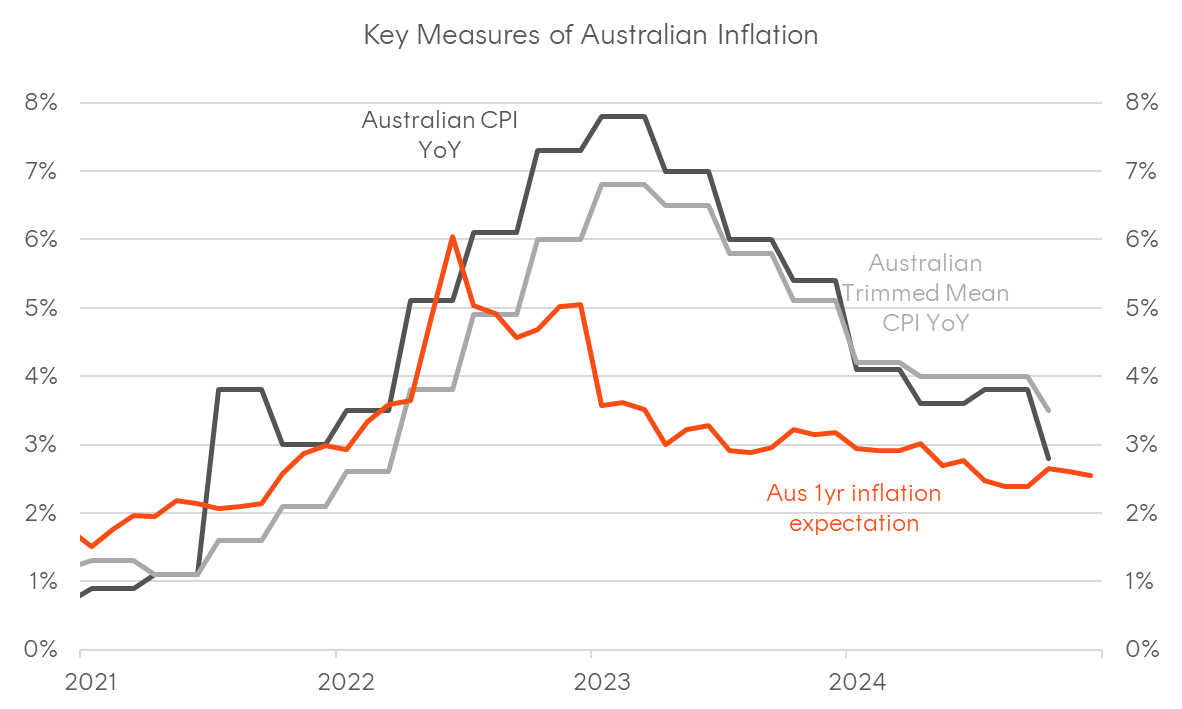
Chart 5: Measures of Australian inflation; quarterly data shown as monthly frequency; 1-year expectations inferred from inflation swaps.
Source: ABS, Bloomberg
Chart 6: USD corporate bond issuance, breakdown by BICS sectors, as at 31-Dec-2024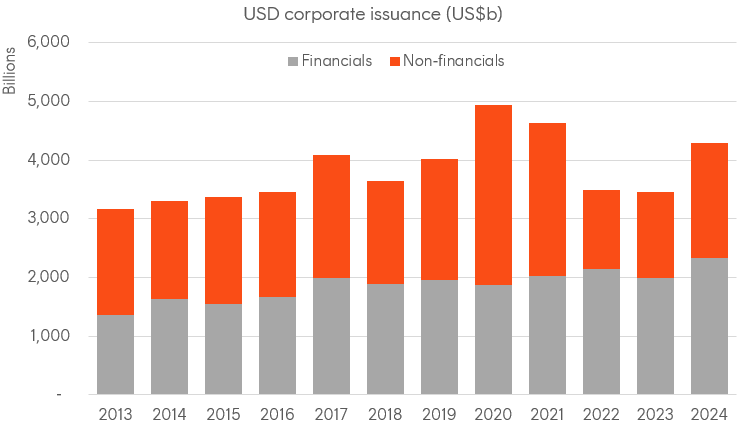
Source: Bloomberg
Chart 7: AUD corporate bond issuance, breakdown by BICS sectors
Source: Bloomberg, as at 31 December 2024.
Chart 8: Australian interest rates
Source: Bloomberg, as at 31 December 2024.
Chart 9: US interest rates
Source: Bloomberg, as at 31 December 2024.
Chart 10: Global economic surprises

Source: Citi, as at 31 December 2024.
Chart 11: Corporate bond spreads
Source: Bloomberg, as at 31 December 2024.
Chart 12: Australian major bank FRN spreads
Source: Bloomberg, as at 31 December 2024.
Chart 13: US 10-year real yields and estimated term premium
Source: NY Fed; Bloomberg


