Why the best investors think in decades
13 minutes reading time
- Fixed income, cash & hybrids
Global macro and rates
Global developments
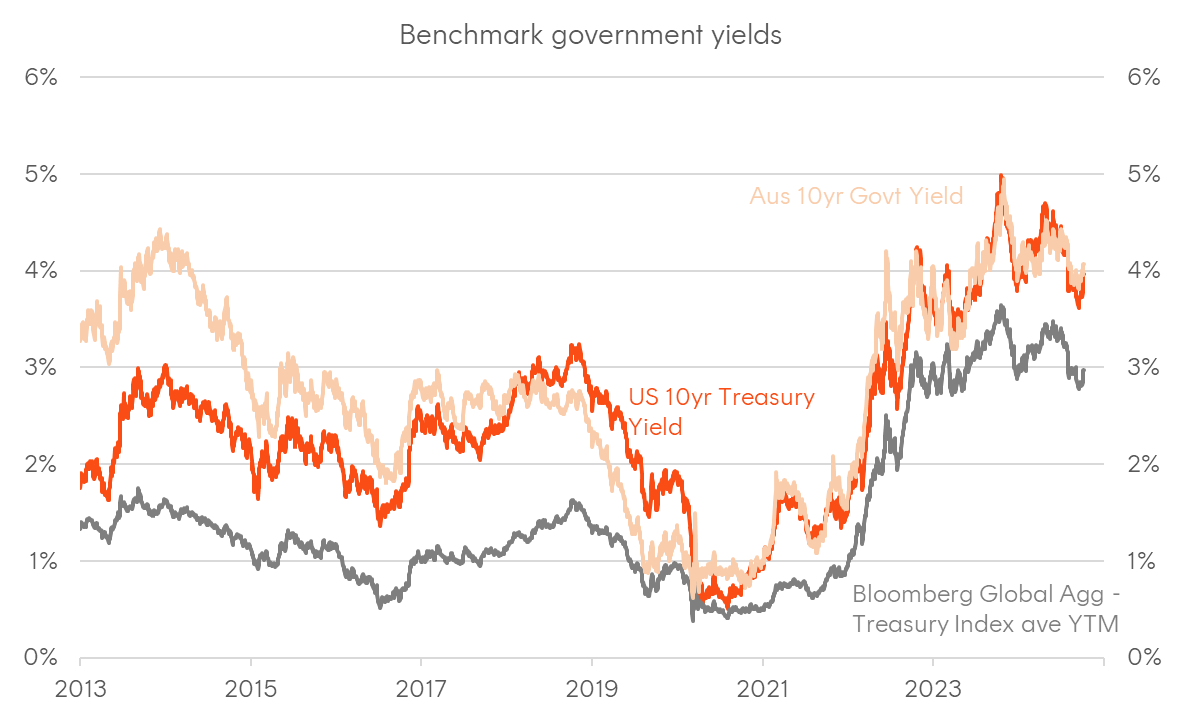
Global bond yields declined significantly during the September quarter as central banks around the world transitioned to easing cycles amid a continued moderation in inflation pressures and softer labour markets. The weighted average yield on the Bloomberg Global Treasury Index declined by 51 basis points over the quarter (to finish at 2.85%), while the benchmark US 10-year Treasury yield fell 62 basis points to end the period at 3.78%, with key yield curve measures, such as the 10-year/2-year US Treasury spread (“2s10s”), un-inverting for the first time in two years. Further rate cuts from some central banks (e.g., the Swiss National Bank, European Central Bank, and Bank of Canada), and the initiation of cuts by others, notably the Federal Reserve, Bank of England, and Reserve Bank of New Zealand, was the defining theme of the quarter.
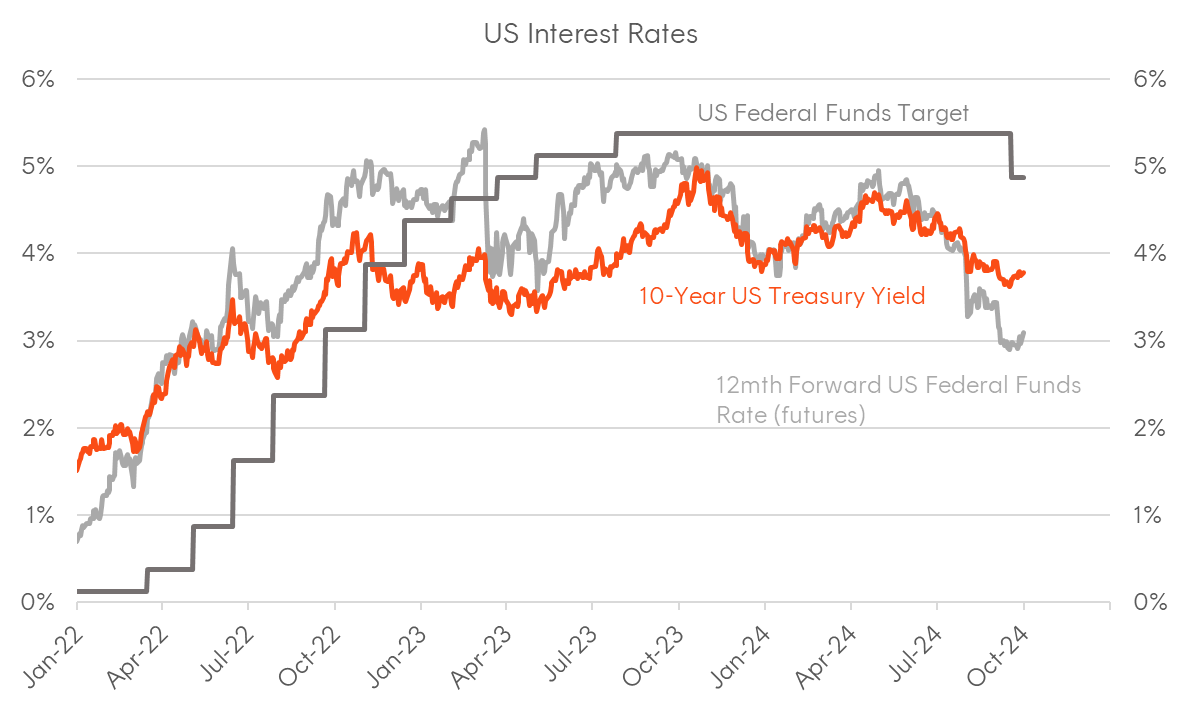
In the United States, the Federal Open Market Committee (FOMC) cut the policy rate by 50 basis points in September, bringing the federal funds target band to 4.75%-5.00%, following an unchanged stance in July. The September rate cut was driven by a sustained moderation in inflation and weaker labour market indicators. The updated Summary of Economic Projections (SEP) showed slight downward revisions to inflation forecasts and slight upward revisions to unemployment projections, though largely maintaining a soft-landing outlook. Additionally, the updated “Dot Plot” revealed a median FOMC expectation for the Fed funds midpoint to end the year at 4.4% and 2025 at 3.4%, showing further expected cuts of 50 basis points over the remaining two meetings this year and a further 100 basis points in 2025. By 2026, the median FOMC member expects the Fed funds rate stabilising around 2.9%, arguably the best estimate of the “neutral rate”.
In September, the ECB cut its deposit rate by 25 basis points to 3.5%, continuing the easing cycle that began in June. This move reflected the ECB’s concern over subdued growth within the region. Elsewhere, the BoE, BoC, and RBNZ all reduced rates during the quarter. In August, the BoE cut the Bank Rate by 25 basis points to 5.00%, reflecting the easing headline and core inflation, while recognising wage-driven pressures in sectors like services. The BoC followed a similar path, reducing its overnight rate by 25 basis points in both July and September to reach 4.25%, citing a weaker household sector and a softer labour market. Finally, the RBNZ reduced its Official Cash Rate by 25 basis points in August, bringing it to 5.25% (with the RBNZ cutting by 50 basis points again in early October to take the rate to 4.75% at the time of writing), motivated by inflation returning towards its target band and a slowing economy.
The main outlier to the global easing cycle was the Bank of Japan (BoJ), which raised its policy rate from 0.10% to 0.25% in July and held it steady in September. This shift reflected Japan’s ongoing economic recovery, supported by rising wages and steady inflation between 2.5% and 3.0%. The timing of the BoJ’s rate hike coincided with weaker US data and a sharp decline in US bond yields, which triggered an aggressive short-covering rally in the yen and a broader deleveraging event across risk assets in early August. Following market turbulence, the BoJ and Japanese government officials, including the new incoming Prime Minister, made efforts to ease concerns.
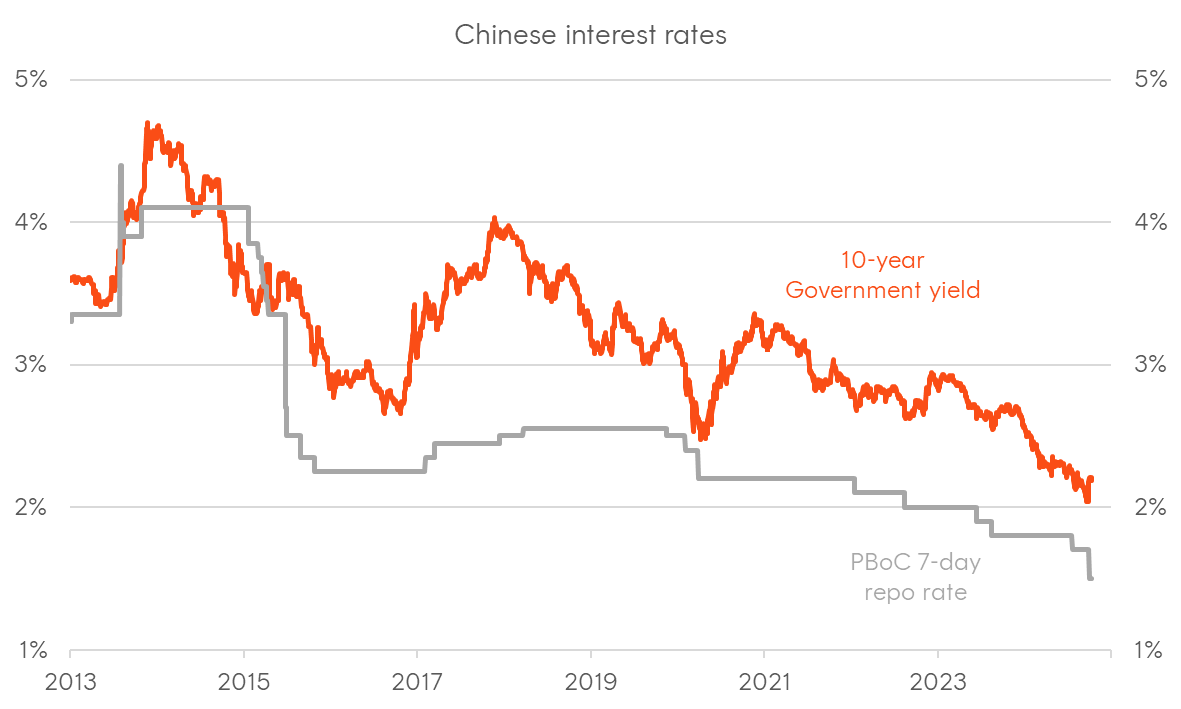
Another significant development occurred late in the quarter, with Chinese policymakers announcing various monetary and fiscal measures aimed at stimulating the economy and supporting specific financial markets, including a 20-basis point cut to the PBoC’s 7-day repo rate (following a 10bps cut in July to take the rate to 1.5%). While details of the fiscal package are still scarce at the time of writing, the initial market response had been positive, reflecting optimism that the Chinese government is taking concrete steps to bolster economic confidence and aggregate demand. Reflecting a rebound in growth and inflation expectations, Chinese 10-year Government bond yields rose by 30 basis points in the week following the announcement, after hitting a cycle low of 2.04% amid ongoing deflationary pressures.
Finally, geopolitical risks were a focal point as tensions in the Middle East escalated, affecting bond markets largely via inflation expectations, which began to rebound in late September. The rise in TIPS breakevens was mainly due to optimism around a re-acceleration in US growth and higher crude oil prices.
Domestic developments
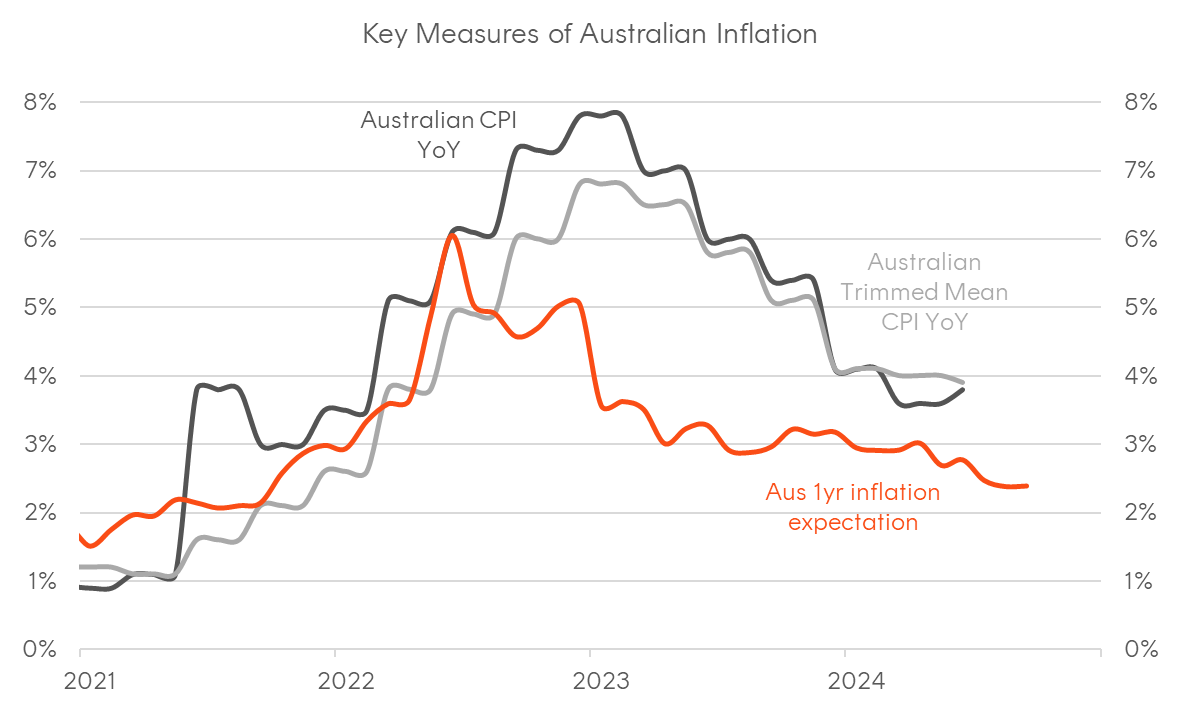
During the quarter, Australian government bonds largely reflected the global moves, although tended to underperform peers, with the 10-year Commonwealth yield ending the period 34 basis points lower to finish at 3.97%. During the September quarter, the Reserve Bank of Australia (RBA) kept the cash rate target at 4.35%, with the Bank highlighting the persistence of inflationary pressures, particularly in the services sector. Uncertainty in the economic outlook, both domestically and internationally, was acknowledged, as were rising geopolitical risks. The RBA emphasised its commitment to keeping monetary policy restrictive until inflation returns sustainably to target. As a result of the global developments, market pricing largely moved to reflect a high likelihood the RBA would be forced into the global easing cycle, with Cash Rate Futures fully pricing in the first cut by February 2025 and 1-year market implied inflation expectations trading within the RBA’s target band.
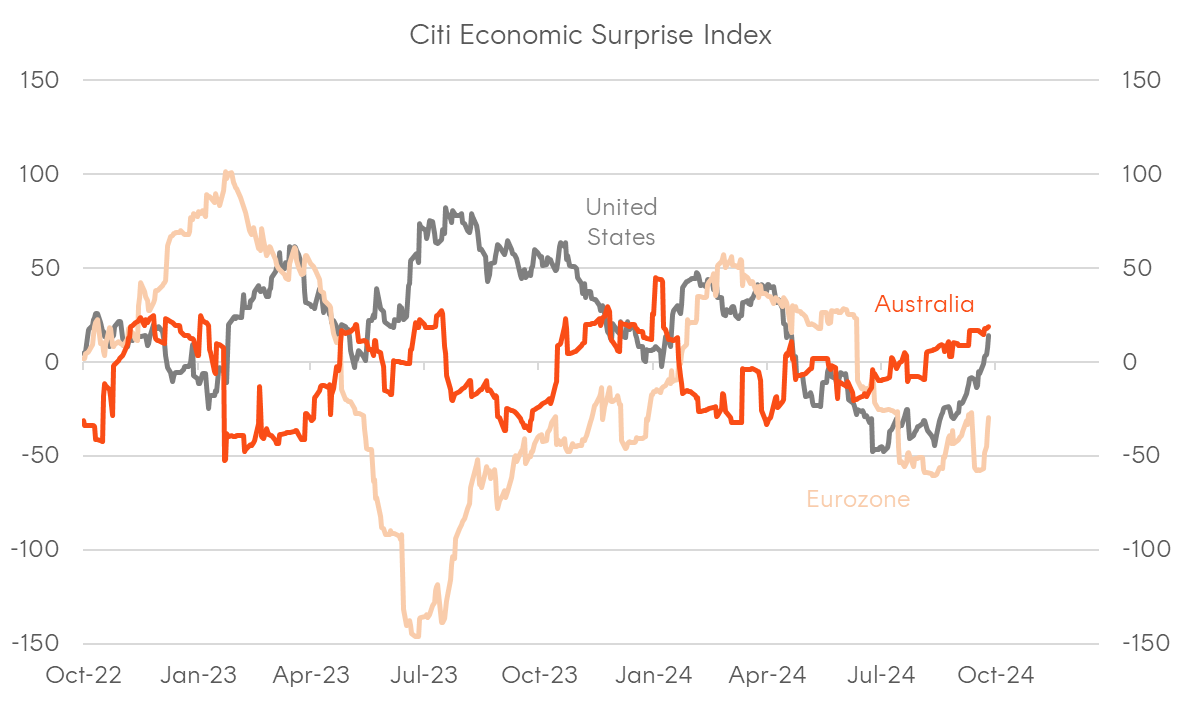
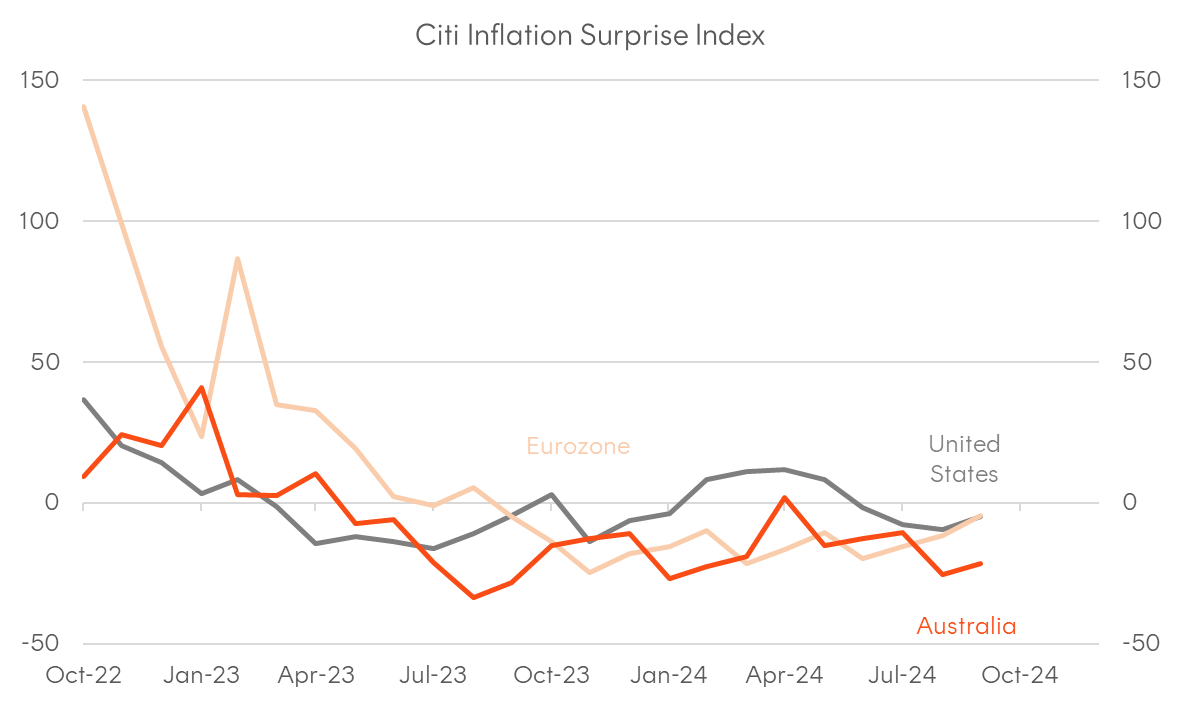
During the period, domestic economic data was subdued, with inflation staying above the RBA’s target, but tended to undershoot expectations. Activity data generally beat expectations on balance, with retail sales data surprisingly robust. The labour market continued to loosen at the margin, with the unemployment rate stabilising around 4.2%. The external sector faced headwinds relating to a slowing global economy and very weak iron ore prices, although base metals staged a rebound towards the end of the month on the bank of the latest stimulus announcement from China.
Credit Markets
Global credit
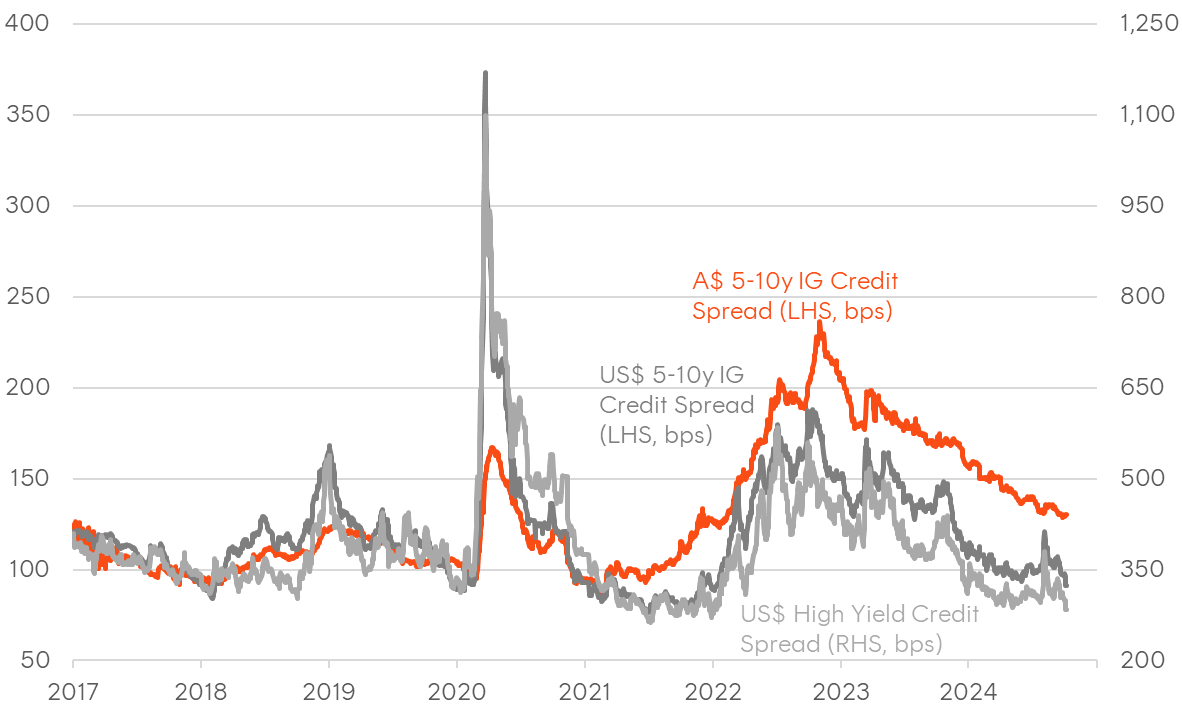
Global credit spreads compressed over Q3, with tightening across both investment-grade and high-yield markets. In the US, 5–10-year investment-grade spreads narrowed by 6 basis points to 96 basis points over US Treasuries, while high-yield spreads compressed by 11 basis points to 300 basis points over the benchmark. While briefly interrupted by the August deleveraging event following the “yen carry trade unwind” and volatility in French sovereign spreads following a new coalition government announcement, spreads quickly realigned with broader optimism around central bank easing, supporting demand for corporate credit.
In terms of supply, US dollar corporate bond issuance expanded over the quarter, reflecting improved sentiment on the part of corporate Treasurers amid the start of the US rate cutting cycle, a decline in corporate bond yields, and a still-robust US economy.
Domestic credit
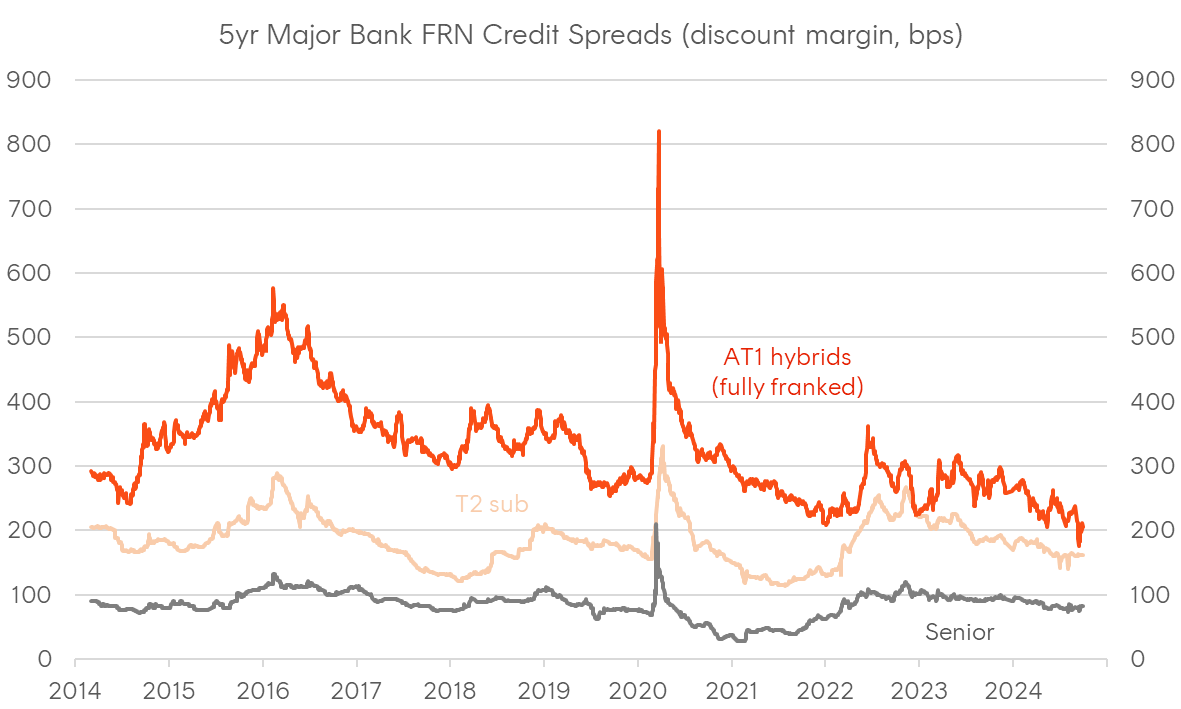
In Australia, 5–10-year investment-grade corporate bond spreads followed a similar trend, tightening 10 basis points to 130 basis points above Commonwealth Government yields, helped by a compression in longer-dated swap spreads. Separately, floating rate spreads across the bank capital structure ended little changed. Domestic corporate bond issuance was robust over the period, led by non-bank financials.
One of the most significant domestic credit developments during the quarter was APRA’s announcement and discussion paper outlining its plans to phase out Additional Tier 1 (AT1) bank hybrid instruments. The proposal aims to replace AT1 with Common Equity Tier 1 (CET1) and Tier 2 capital for larger banks, enhancing the framework’s ability to absorb losses and support bank resolutions during financial crises. Larger banks, including the four majors and Macquarie, would replace AT1 with 1.25% Tier 2 and 0.25% CET1 capital, while smaller banks can fully substitute AT1 with Tier 2 capital. This change does not affect insurers.
APRA’s decision follows concerns highlighted by international banking crises, which exposed limitations in AT1’s loss absorption capabilities, in addition to concerns around the proportion of retail ownership of such instruments in Australia. APRA’s proposed timeline for phasing out AT1 capital instruments begins with banks adjusting their capital structures by replacing AT1 with Tier 2 and CET1 by 1 January 2027. From that point onwards, existing AT1 instruments will continue to qualify as regulatory capital until their first call dates and will be treated as Tier 2 capital from the regulator’s perspective until they are entirely phased out by 2032, aligning with the final first call dates. A consultation period has begun, with further communication on specific prudential standard changes expected in 2025.
In response to the APRA announcement, AT1 spreads initially compressed aggressively, while Tier 2 spreads widened modestly on expectations of further supply and concerns around ratings implications. However, this first move was quickly unwound, given the added Tier 2 supply is expected to be easily absorbed given the demand for such debt from a range of sources over the coming years. In addition, later commentary from the ratings agencies suggests the proposed changed would not have any impact.
Outlook
The global easing cycle, which started in the first half of the year, has brought more central banks into its orbit and is now the dominant macro theme. While central banks, including the Fed, have previously focused on combating inflation, the main risk now appears to be shifting towards employment and growth. This shift is clear in the re-emergence of a negative return correlation between US Treasuries and US equities, suggesting duration is once again functioning as a portfolio diversifier.
As we enter the new quarter, the debate centres on how far the Fed will go and where the “neutral” rate might ultimately settle. With recent US labour market data surprising on the upside, rate cut expectations have moderated somewhat. Inflation expectations are also showing signs of recovery, driven by rising crude oil prices amid rising geopolitical tensions. Based on the Fed’s dot plot and guidance, most FOMC members still see the nominal neutral Fed funds rate around 2.90%. However, the resilience of the US economy might imply a higher neutral rate. This question over where “neutral” is should be balanced by the momentum long duration bonds typically have during a global rate cutting cycle, in addition to the optionality and convexity such instruments enjoy.
The announcement of new stimulus from Chinese authorities – combining further monetary easing with fiscal measures – was initially met with optimism across risk assets. However, as details have begun to appear in early October, much of the initial euphoria has faded, with the size of the fiscal package falling short of market expectations. Specifics are limited at the time of writing, and further measures could still be announced. A large fiscal stimulus package aimed at boosting domestic demand could be a turning point for the Chinese economy and carry significant global implications. For the past three years, Chinese government bonds (CGBs) have been standout performers, reflecting the economy’s fight with deflation, in contrast to the inflation pressures other large economies were dealing with. The true indicator of the success of any fiscal stimulus would be a substantial rise in long-term CGB yields, yet so far, the jump in 10-year yields appears more as a correction within a multi-year trend.
In Australia, the RBA continues to adopt a more hawkish posture compared to other central banks. However, as a medium-sized open economy with significant global linkages, the RBA’s policy outlook is often heavily influenced by the Fed and others. Furthermore, “peer economies” like New Zealand and Canada are showing signs of economic stress and it’s likely that both the RBNZ and BoC will need to undertake much more aggressive easing measures. Given the similarities with those economies, it’s plausible Australia might be subject to the same headwinds but might be at a different stage of the cycle. Ultimately, while trimmed mean inflation remains above the RBA’s target band, the broader trend is for a continued moderation given the domestic lag to the global disinflationary impulse. In addition, like other developed economies, the Australian labour market continues to loosen, with unemployment staying low, but broadly trending higher. This backdrop suggests a constructive outlook for Australian fixed-rate bonds from a relative value perspective, particularly given the steeper yield curve and fewer rate cuts priced in compared to global peers.
The soft landing is still our base case for both the US and Australian economies, and continued moderation in inflation is likely to encourage both the Fed and RBA to cut rates and get policy to a “neutral” level relatively quickly. This environment should be supportive for fixed income overall, especially fixed-rate credit, which stands to benefit from a combination of lower yields and spread compression. While a hard landing would likely widen spreads, it would also necessitate further accommodative policy, allowing investment-grade fixed-rate credit to perform from the duration channel offsetting any credit headwinds.
Chart 1: G7 + Australasia Policy Rates Implied forward rates from futures or overnight indexed swaps
| Country | Dec-23 | Sep-24 | Dec-24 implied rate | Expected rate change over rest of 2024 |
| United States | 5.375% | 4.875% | 4.178% | -0.697% |
| Euro Zone | 4.000% | 3.500% | 2.970% | -0.530% |
| Japan | -0.100% | 0.250% | 0.318% | +0.068% |
| United Kingdom | 5.250% | 5.000% | 4.623% | -0.377% |
| Canada | 5.000% | 4.250% | 3.474% | -0.776% |
| Australia | 4.350% | 4.350% | 4.267% | -0.083% |
| New Zealand | 5.500% | 5.250% | 4.358% | -0.892% |
Source: Bloomberg as at 30 September 2024
Chart 2: 10-year Government bond yields
Source: Bloomberg as at 30 September 2024
Chart 3: Chinese benchmark interest rates
Source: Bloomberg as at 30 September 2024
Chart 4: Measures of US inflation; 1-year expectations inferred from inflation swaps

Source: BLS, Bloomberg
Chart 5: Measures of Australian inflation; quarterly data shown as monthly frequency; 1-year expectations inferred from inflation swaps
Source: ABS, Bloomberg
Chart 6: Australian interest rates

Source: Bloomberg as at 30 September 2024
Chart 7: US interest rates
Source: Bloomberg as at 30 September 2024
Chart 8: Global economic surprises
Source: Citi as at 30 September 2024
Chart 9: Global inflation surprises
Source: Citi as at 30 September 2024
Chart 10: Corporate bond spreads
Source: Bloomberg as at 30 September 2024
Chart 11: Australian major bank FRN spreads
Source: Bloomberg as at 30 September 2024
Chart 12: USD corporate bond issuance, breakdown by BICS sectors
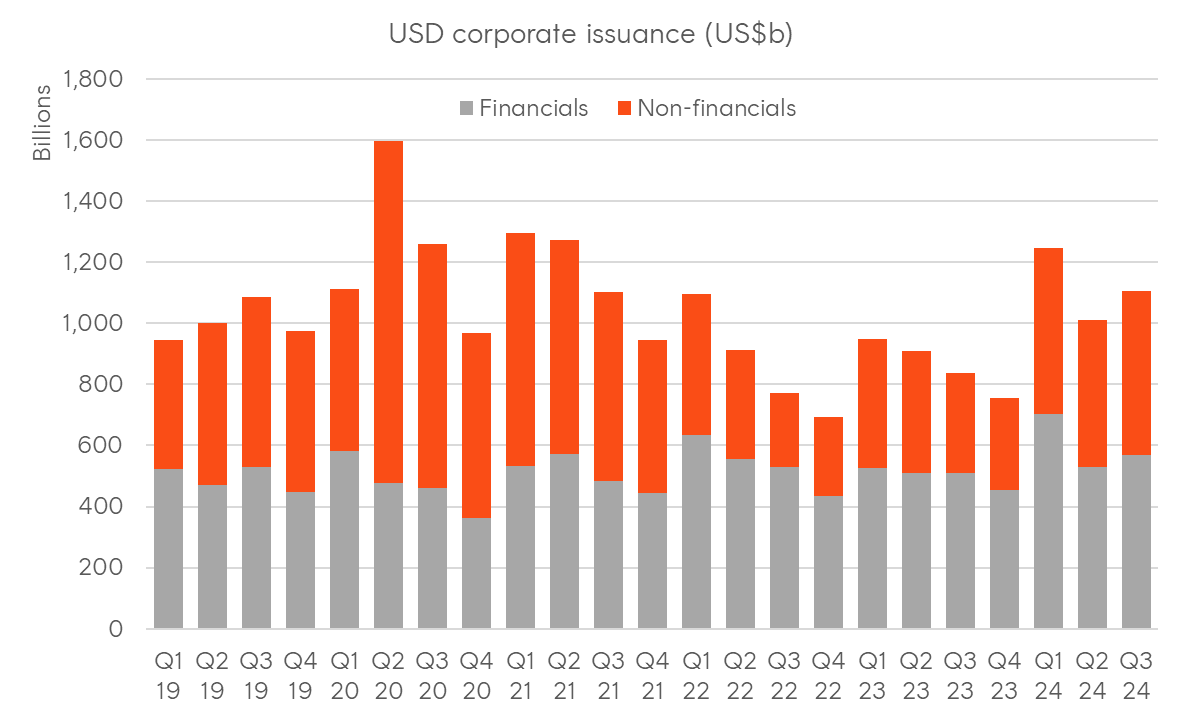
Source: Bloomberg as at 30 September 2024
Chart 13: AUD corporate bond issuance, breakdown by BICS sectors

Source: Bloomberg as at 30 September 2024


