
Nvidia earnings to highlight week ahead

Chamath De Silva
14 minutes reading time
- Fixed income, cash & hybrids
Related articles


This information is for the use of licensed financial advisers and other wholesale clients only.
Quarterly commentary from the Betashares portfolio management desk by head of fixed income Chamath De Silva. Providing an overview on global macroeconomic events, central bank policy, fixed income markets and an outlook for the next quarter.
Global macro and rates
Global developments
Global bond yields consolidated over the quarter, with the average yield on developed market government securities ending 20 basis points higher. This was a period characterised by declining interest rate volatility, a slowing US economy, and interest rate cuts from several central banks, potentially marking the beginning of a global easing cycle. US Treasury yields rose across the curve with a slight steepening bias (10yr +20bps; 2yr +13bps), with policy rate expectations over the next 12 months largely unchanged. The move in nominal yields was largely reflected in real yields, with long-term inflation expectations moderating slightly. US inflation began to surprise on the downside, while the Citi US economic surprise index of activity data stayed negative for much of the quarter. A nascent rebound in manufacturing struggled to gain momentum, with the ISM index of purchasing manager intentions returning to contractionary territory, with the services ISM also dropping below 50 in June.
In Q2, the Federal Reserve’s Federal Open Market Committee (FOMC) held meetings in May and June, deciding to keep the federal funds rate target range unchanged at 5.25%-5.50%. In May, the Fed’s dovish outlook led to mixed market reactions with initial gains in equities and drops in Treasury yields, which later reversed. In June, the Fed’s dot plot revised the expected number of 2024 rate cuts from three to one, reflecting a more cautious approach amidst persistent inflation concerns. Despite this hawkish tweak, the Fed maintained an easing bias by the end of the quarter, with the market still anticipating rate cuts to being by September.
Key monetary policy developments occurred outside the US, with the Bank of Canada (BoC) and European Central Bank (ECB) commencing their respective easing cycles, cutting policy rates by 25 basis points each. The ECB lowered its key interest rates to 4.25%, 4.50%, and 3.75% for the main refinancing rate, marginal lending facility rate, and deposit facility rate, respectively, reflecting an improved inflation outlook despite ongoing domestic price pressures. Concurrently, the BoC reduced its policy rate to 4.75%, citing signs of easing core inflation and progress towards the 2% inflation target despite strong wage growth. Both central banks emphasised a data-dependent approach, with market pricing indicating further cuts. This followed the Swiss National Bank, which enacted a second rate cut in June, with Swiss y/y CPI falling below 2% in mid-2023. Elsewhere in Europe, the Bank of England’s Monetary Policy Committee (MPC) maintained the Bank Rate at 5.25%, with headline CPI inflation falling to 2% and market pricing suggesting a high likelihood of a rate cut in Q3.
During its April and June 2024 meetings, the Bank of Japan (BoJ) maintained its policy of keeping interest rates unchanged, with the overnight policy rate between 0% and 0.10%, while continuing its purchases of Japanese government bonds, commercial paper, and corporate bonds. However, in June, the BoJ slightly reduced the purchase amount of Japanese government bonds to allow long-term interest rates to form more freely in financial markets. This decision came amidst a moderate economic recovery, marked by improvements in corporate profits, business fixed investment, and resilient private consumption, despite weaknesses in exports and housing investment. The BoJ projected continued moderate growth and anticipated underlying CPI inflation to rise gradually towards the price stability target. Market-implied measures of long-term inflation expectations continued to rise over the period, and JGB yields “bear-steepened” aggressively (long-term yields rising by more than short-term yields), with the 10-year yield ending 33 basis points higher to close above 1% – a cycle high and the highest level since late 2011. However, the fact that the BoJ signalled that any policy normalisation would be very gradual coincided with a significant yen selloff, causing the USD/JPY exchange rate to surpass 160, the weakest yen level against the US dollar since 1986, and pushing the AUD/JPY exchange rate to its highest level since 2007.
Domestic developments
In Australia, bond yields rose slightly more than the global average, with the 10-year Commonwealth government yield ending the quarter 35 basis points higher. This underperformance was largely due to above-expected inflation data (both the Q1 quarterly release and the May monthly series) and a relatively hawkish trajectory for RBA cash rate expectations. Activity data overall presented a mixed picture, with Q1 GDP falling short of estimates, indicating an economy running below trend, mirrored by the domestic manufacturing PMI gauge consistently printing below 50. However, services PMI gauges and retail sales remained robust.
The slower-than-expected inflation moderation increased the likelihood of the RBA’s August meeting being “in play,” potentially requiring upwards revisions to the Bank’s inflation forecasts at the next Statement on Monetary Policy. The May board meeting saw no change in the cash rate, although the minutes indicated a hike was considered amid the sticky inflation pressures. While Q1 CPI exceeded expectations, wages growth fell short, with the labour market showing signs of slack as the unemployment rate returned to 4%.
The June quarter saw the RBA’s term funding facility (TFF) formally conclude, with $95 billion in final maturities repaid during the period. At its height in 2022, the TFF had grown to $188 billion, profoundly impacting domestic liquidity conditions and wholesale funding needs. Additionally, the RBA unveiled an updated assessment of the neutral rate, with the nominal estimate at 3.5% and the range from various models between 3% and 3.75%. The RBA also presented a dashboard of financial conditions covering market-based and real economy metrics, reinforcing the view that policy is restrictive and is slowing demand throughout the economy.
Another development of note was the Commonwealth’s inaugural green bond sale in June, which saw $7 billion of 10-year bonds heavily over-subscribed (attracting an order book of $22.9 billion), creating a small “greenium” (premium to the non-green curve) post issuance. The sale saw broad based buying from both domestic and global real money, with 63 per cent of the allocation going to fund managers and 65 per cent going to domestic investors. The stated purpose of the green bond program is to finance public projects that support the transition to net zero by 2050.
Credit
Global credit spreads ended the quarter largely unchanged, with the compression seen at the beginning of the month pausing due to escalating political concerns in the Eurozone. The average of 5–10-year USD investment-grade spreads remained stable through June, while US corporate high-yield spreads widened slightly. USD issuance moderated following a surge in debt sales in Q1, with many corporates taking advantage of the earlier plunge in Treasury yields.
During Q2 2024, Eurozone sovereign spreads widened, driven by political and fiscal uncertainties in key member states. In France, President Macron’s call for snap national parliamentary elections in response to the surge of populist parties in the European parliamentary elections rekindled memories of the Eurozone crisis from the early 2010s. The yield spread between French government bonds (OATs) and German bunds widened sharply, reflecting increased investor concerns over France’s fiscal stability and political direction. This political uncertainty also impacted other Eurozone countries, with Italian and Greek spreads widening in sympathy, indicating broader market apprehension about potential fiscal indiscipline and the European Union’s integrity.
In Australia, credit spreads compressed and converged towards tighter USD equivalents, with minimal spillover effects from Europe. Further compression in swap spreads supported corporate compression to government spreads. However, Australian state government bonds, particularly those issued by Victoria and New South Wales (NSW), experienced significant spread widening against Commonwealth Government Securities (CGS) due to deteriorating fiscal positions. The issuance of state government bonds exceeded the demand from banks for High-Quality Liquid Assets (HQLA), contributing to the widening spreads. Despite general compression in other AUD credit spreads, state government bonds emerged as an outlier, reflecting heightened fiscal sustainability concerns. However, the spread widening was viewed as a dip-buying opportunity by some market participants, anticipating potential stabilisation or improvement in fiscal management, with the NSW budget spurring a reversal of the earlier spread widening towards the end of the quarter.
In domestic bank credit, senior spreads on major bank FRNs compressed slightly as issuance slowed down, which much of the TFF-related pre-funding did previously. The prior quarter’s upgrade of major bank Tier 2 (and AT1) paper supported strong investor demand across the subordinated segment, with discount margins now having compressed around 100 basis points from the 2022 wides.
AUD corporate bond issuance fell during Q4, with less issuance from financials, potentially due to front-loading of issuance at the start of the year ahead of the RBA’s TFF unwinding in June. However, non-financial corporate issuance rose slightly, potentially in response to spread compression and strong investor appetite, with industrials, infrastructure, and consumer staples leading the sales.
Outlook
With the Northern Hemisphere summer upon us, activity and volatility levels are subdued, but it appears a turning point has been reached in the global policy cycle. With Switzerland, Canada, and the Eurozone having started a cutting cycle and the Fed still signalling rate cuts, it’s increasingly likely that the global easing cycle has already begun. With rate cuts also priced in for New Zealand and the UK, Australia stands out, with cash rate futures still expecting further rate hikes this year. This raises questions: 1) can domestic inflation defy the global disinflationary trend? And 2) will the RBA defy the global easing trend? The inflation cycle of 2021-2022 was characterised by its global nature, although price pressures were not perfectly synchronised. Inflation peaked in Australia roughly 6 months after the US, and it’s possible the broader disinflationary trend seen globally is already here, operating with a lag. The Australian economy and bond market don’t exist in a vacuum, and if the Fed starts cutting this year, any resumption in an RBA hiking cycle would likely be short-lived.
The environment for fixed income appears constructive overall. The US economy, while slowing, seems robust enough to avoid a recession this year. While some inflation measures remain sticky, the broad collection of gauges policymakers and economists look at are on a trajectory to return towards the Fed’s target, and the Fed has indicated it wouldn’t wait until 2% was achieved. A failure to pre-emptively cut, in the Fed’s view, would tighten policy further via a mechanical increase in real interest rates. Such an environment tends to favour credit, and spreads may continue compressing if interest rate volatility moderates. Rate cuts tend to support government bonds, but the degree matters since an easing cycle is already reflected in several yield curves around the world, including the Treasury market. Typically, policy easing should steepen the curve, but whether long-end yields decline in outright terms will depend on why the Fed is cutting rates. Cuts in response to a recession or credit stress would likely see yields across all maturities rapidly decline. In contrast, easing policy towards neutral on moderating inflation probably won’t provide as much benefit to long-term bonds if cuts are already priced in, especially if a soft landing confirms a higher “neutral rate” than in previous cycles. With the Fed’s latest dot plot suggesting a nominal neutral rate of 2.75%, a soft landing while rates are around 5% might require further upward revisions.
In contrast to the US treasury market, the Australian sovereign curve is relatively steep, suggesting further hikes and a higher neutral rate than in the US. If the disinflation seen in Europe and the US is due to arrive here, there is greater potential for Australian bonds to outperform due to a more significant repricing of forward rates and bond yields. The RBA’s new financial conditions dashboard and updated neutral rate assessment indicate policy is restrictive, so any inflation moderation should, in theory, allow the bank to follow global peers into rate cuts. Australian dollar credit arguably also presents compelling relative value, with corporate bonds of similar maturity and credit quality trading at spreads around 40 basis points wider than USD equivalents. The persistence of wider corporate spreads (to government) has been due to a liquidity risk premium for AUD securities and an elevated swap spread during the YCC era when the RBA restricted the free float of CGS, making other forms of duration (including swaps and credit) cheaper. With RBA purchases and the term funding facility behind us, swap spreads will likely continue compressing, potentially back towards zero, as seen in the US.
While the global macro backdrop appears supporting for financial assets more broadly, politics remains a growing risk for the market. Elections in the UK, France, and the US threaten to inject additional policy uncertainty across major developed economies. The calling of snap parliamentary elections in France sent shockwaves across Eurozone sovereign debt markets, with French spreads surging in fashion reminiscent of the early 2010s. Potentially compounding the sell-off in French bonds is the interplay with Japanese real money investors, which have long favoured Euro area spread products as a way of enhancing yield over JGBs. Further uncertainty around European unity against a backdrop of rising JGB yields would likely accelerate repatriation flows in a worst-case event. However, a coalition involving the centre in France would likely contain the risk aversion, and any credit spread volatility would likely be short-lived providing a clear runway for markets, at least until the US presidential election in November.
Chart 1: G7 + Australasia Policy Rates
As at 30 June 2024
| Country | Dec-23 | Jun-24 | Dec-24 implied rate | Expected rate change over remainder of 2024 |
| United States | 5.375% | 5.375% | 4.933% | -0.442% |
| Euro Zone | 4.000% | 3.750% | 3.314% | -0.436% |
| Japan | -0.100% | 0.100% | 0.312% | +0.212% |
| United Kingdom | 5.250% | 5.250% | 4.798% | -0.452% |
| Canada | 5.000% | 4.750% | 4.288% | -0.462% |
| Australia | 4.350% | 4.350% | 4.517% | +0.167% |
| New Zealand | 5.500% | 5.500% | 5.191% | -0.309% |
Source: Bloomberg
Chart 2: 10-year Government bond yields
As at 30 June 2024
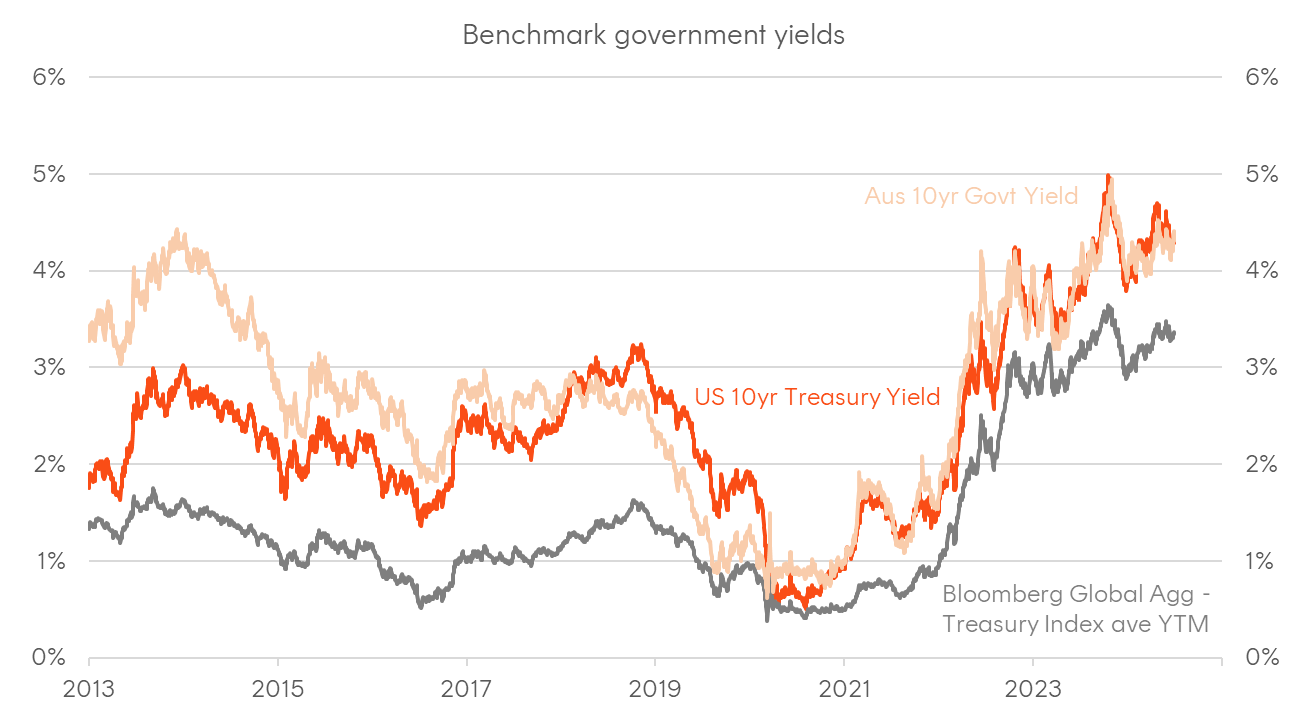
Source: Bloomberg
Chart 3: Quarterly change in balance sheets from selected central banks (US$b)
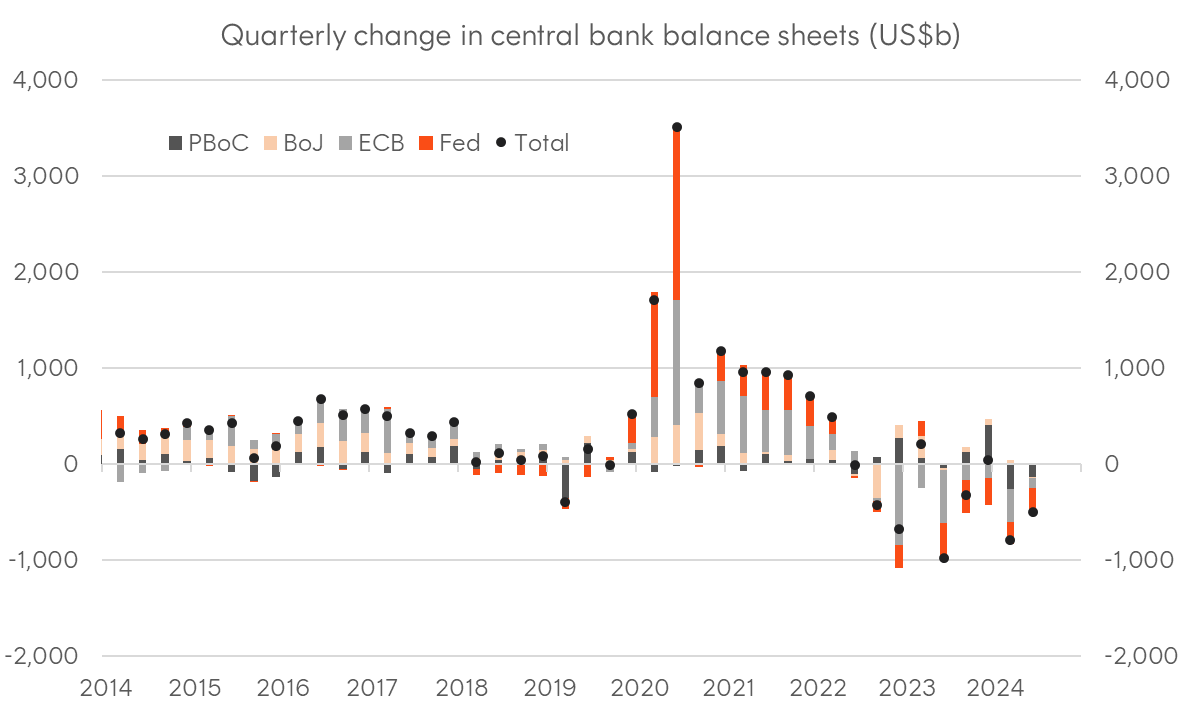
Sources: Bloomberg, Fed, ECB, BoJ, PBoC
Chart 4: USD corporate bond issuance, breakdown by BICS sectors
As at 30 June 2024
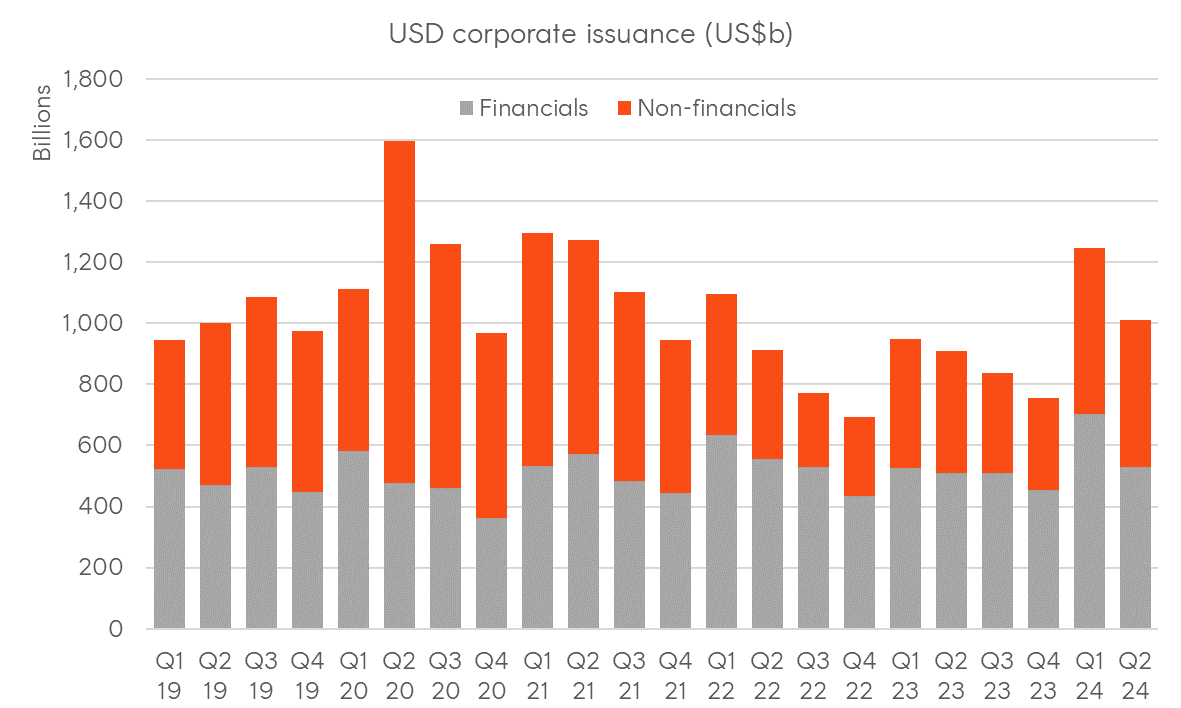
Source: Bloomberg
Chart 5: AUD corporate bond issuance, breakdown by BICS sectors
As at 30 June 2024

Source: Bloomberg
Chart 6: Australian interest rates
As at 30 June 2024
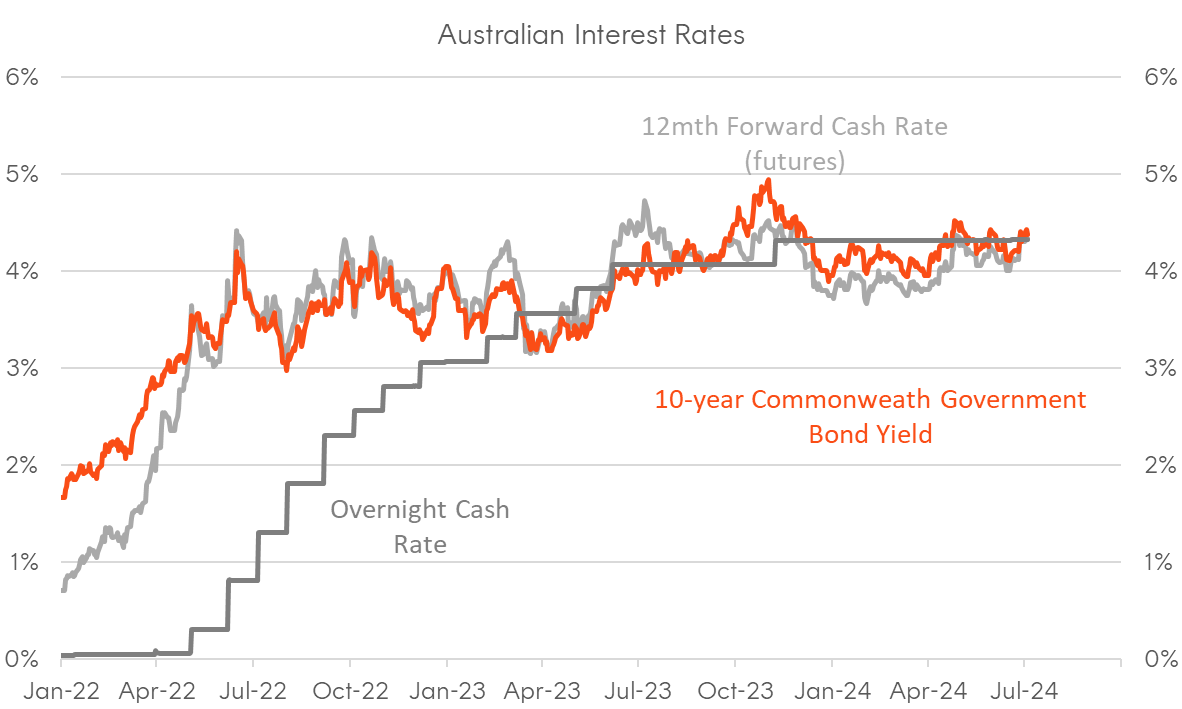
Source: Bloomberg
Chart 7: US interest rates
As at 30 June 2024

Source: Bloomberg
Chart 8: Global economic surprises
As at 30 June 2024
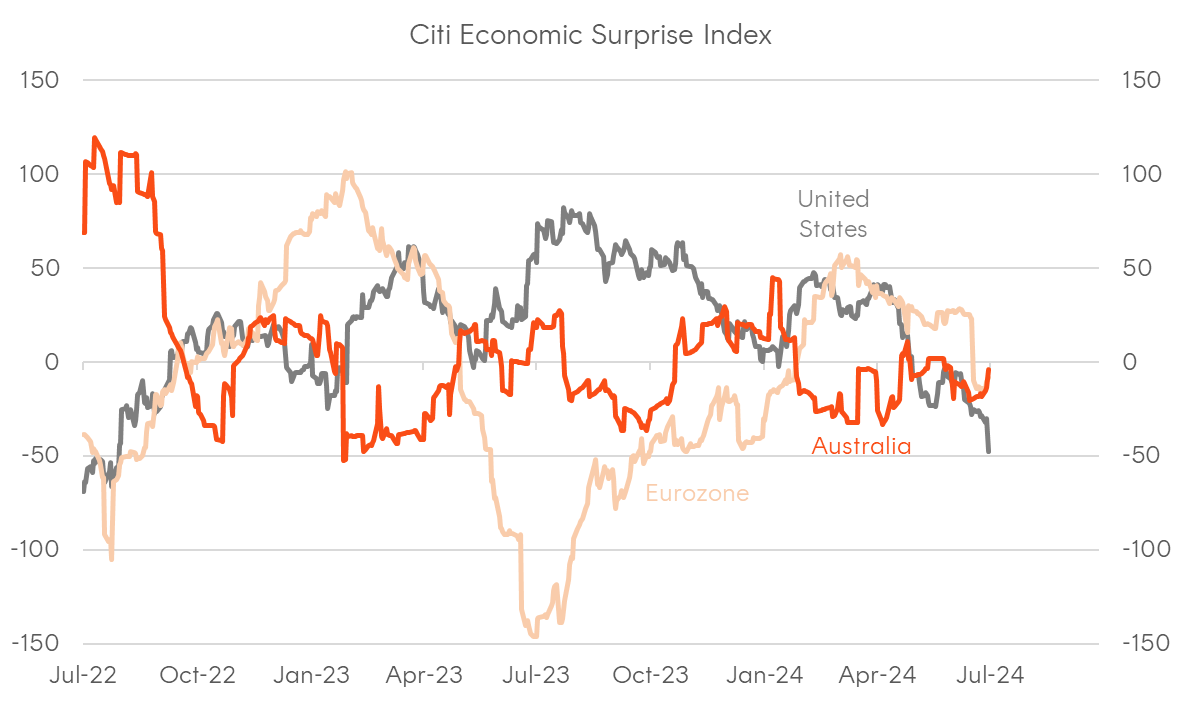
Source: Citi
Chart 9: Global inflation surprises
As at 30 June 2024
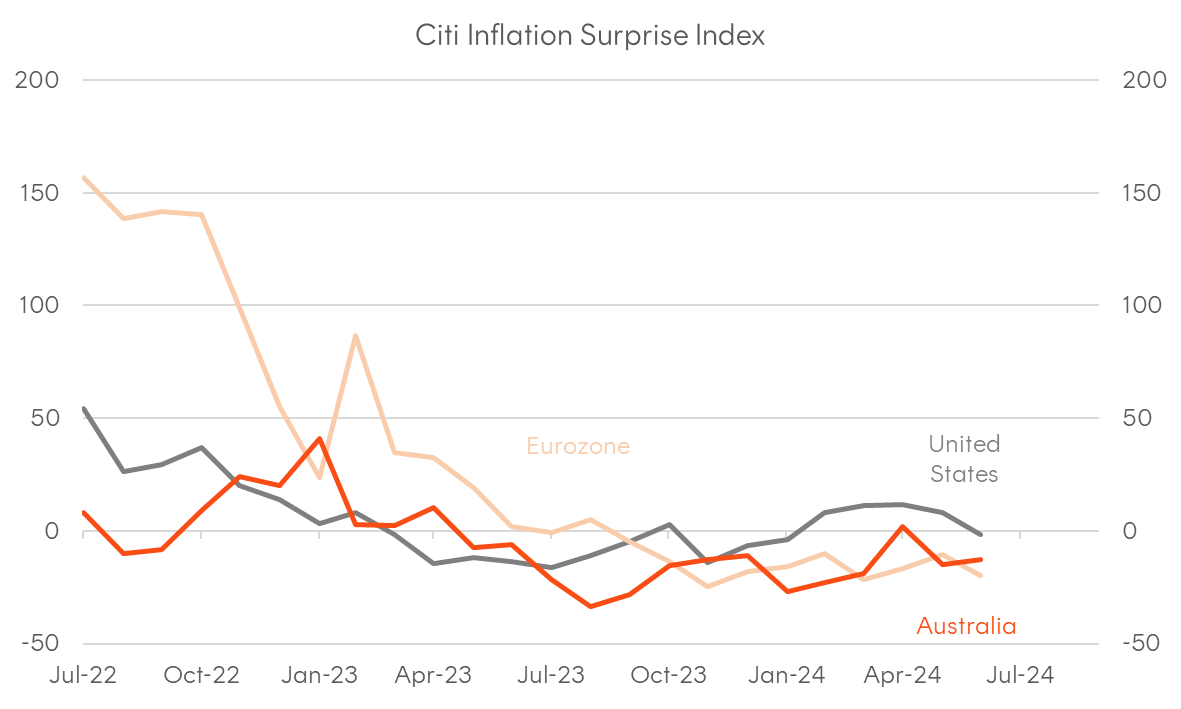
Source: Citi
Chart 10: Corporate bond spreads
As at 30 June 2024
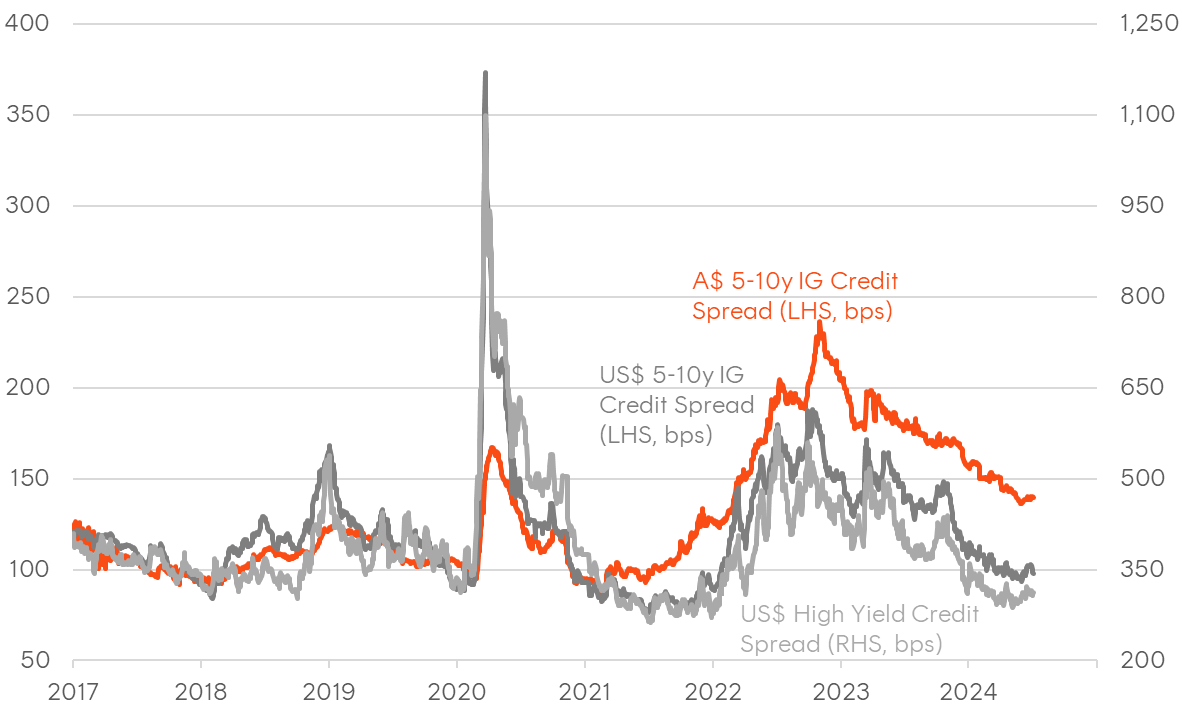
Source: Bloomberg
Chart 11: French 10-year sovereign spreads vs Germany
As at 30 June 2024
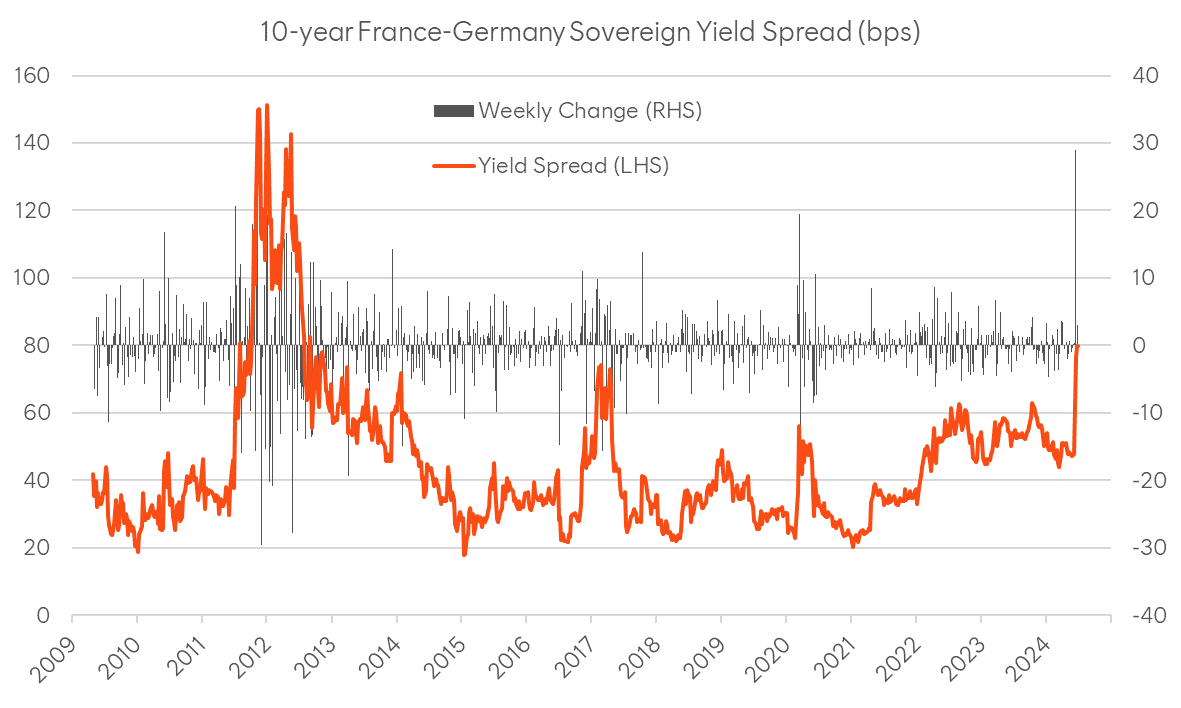
Source: Bloomberg
Chart 12: Australian major bank credit spreads history
As at 30 June 2024
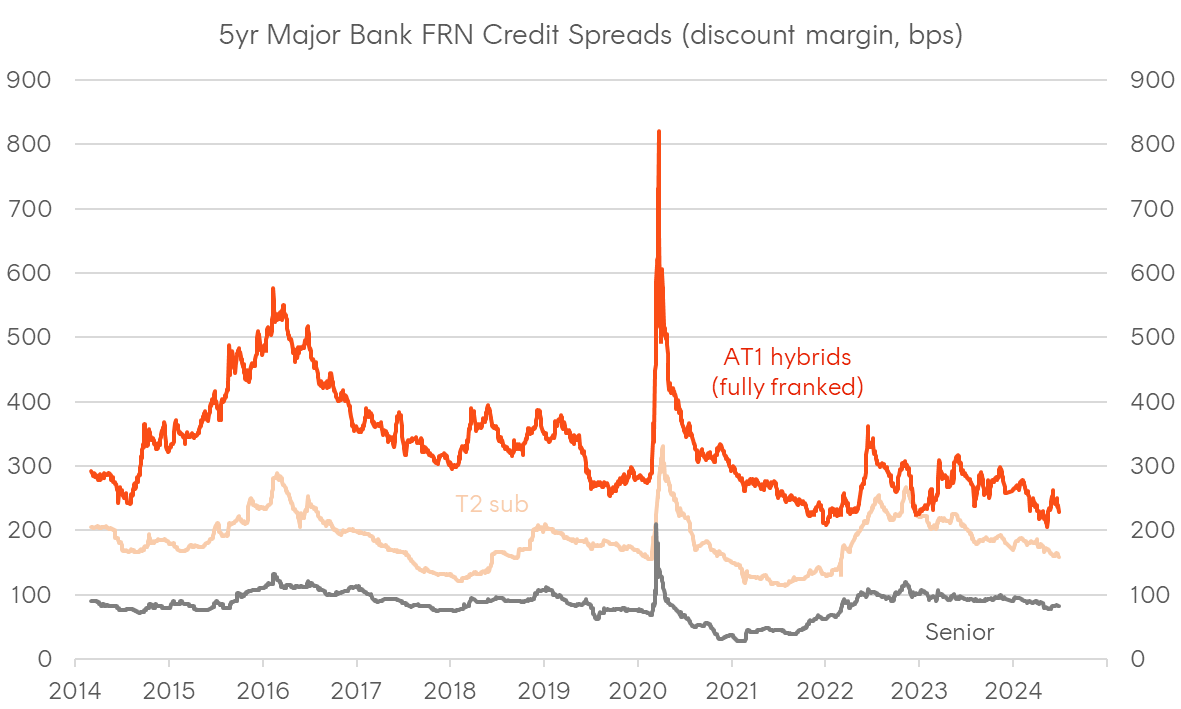
Source: Bloomberg