12 minutes reading time
- Fixed income, cash & hybrids
This information is for the use of licensed financial advisers and other wholesale clients only.
Quarterly commentary from the Betashares portfolio management desk by head of fixed income Chamath De Silva. Providing an overview on global macroeconomic events, central bank policy, fixed income markets and an outlook for the next quarter.
Global macro and rates
The second quarter of 2023 saw a continued focus on policy tightening, with central banks worldwide grappling with persistent inflation pressures amid robust labour markets. Global bond yields climbed as fears of banking stress, which stemmed from the collapse of several US regional banks and the government-brokered takeover of Credit Suisse in Q1, unwound. Surprisingly strong US economic data further contributed to the rise in yields. 10-year US Treasury yields closed the period 37 basis points higher, with 2-year yields spiking by 87 basis points to approximately 5% – a level last seen before the banking crisis.
Similar movements occurred elsewhere; UK gilts saw the most significant repricing across major bond markets, as 2-year gilt yields jumped 183 basis points, surpassing their peak during the September 2022 fiscal crisis. These increases occurred amidst strong inflation and wage growth. Despite a global yield jump, interest rate volatility measures moderated, providing marginal support to risk assets.
Inflation remained a primary concern throughout the quarter. Although most economies’ core and headline inflation tended to surprise on the downside, the overall levels remained worryingly high, particularly given the backdrop of strong nominal demand. US economic activity was especially robust, with the Citi US Economic Surprise index maintaining positive momentum as data consistently exceeded expectations. In contrast, Eurozone activity saw a marked deterioration, with real GDP recording two consecutive quarterly contractions.
Central bank meetings were a key driver of broader narratives. The Federal Open Market Committee raised the Federal Reserve Funds target range in May and held rates steady in June, ending the quarter at 5.00%-5.25%, the highest policy rate since 2007. The updated Summary of Economic Projections (SEP) revealed a significant development, as the median Fed Funds rate projection for year-end was lifted to 5.625%, up 50 basis points from the March “dots”. The SEP’s release coincided with upward revisions to US growth and core inflation for the year, and lower unemployment forecasts. This development solidified the notion of a potential “6-handle” Fed Funds rate, previously hinted at by some Fed officials before the Q1 banking stress.
The European Central Bank (ECB) raised rates in April and June and hinted at another potential hike in July, as Euro area inflation proved slow to moderate. This ongoing focus on monetary policy culminated in the highly anticipated ECB-hosted Forum on Central Banking in Portugal, where the heads of the Fed, ECB, Bank of England, and Bank of Japan (BoJ) shared the stage. Of note, the new BoJ Governor, Ueda, hinted at a potential 2024 policy shift, contingent on upward movement in inflation expectations. This would mark a significant departure from Japan’s prolonged zero/negative interest rate policy, especially as Japan’s core CPI surpassed 4% for the first time in over 40 years.
Global liquidity remained a key focus, with the most substantial central banks all contracting their balance sheets. Despite this apparent liquidity drain, risk assets were largely unaffected, with the anticipated squeeze following the passage of the US debt ceiling bill failing to materialise. Following the bill’s passage, it had been expected that the surge in Treasury bill issuance to rebuild the Treasury General Account would struggle to be absorbed. However, with the reverse repo facility growing well above US$2 trillion, it became clear that significant inflows to money market funds since March provided ample demand to absorb much of the T-bill supply.
In Australia, the Reserve Bank of Australia (RBA) tackled inflation pressures similarly to its peers, executing surprise rate hikes in May and June, bringing the cash rate target to 4.10%, with the data tending to surprise on the upside during the quarter. These hikes followed a pause in April, catching the rates market off-guard in discerning the RBA’s intentions. The repricing during the quarter was dramatic, with terminal rate pricing based on cash rate futures rising over 100 basis points to end around 4.5%, with Commonwealth bond yields experiencing similar moves across the curve to close the quarter above 4% for all maturities.
Other significant domestic developments during the quarter included the release of the RBA Review, which is anticipated to lead to the appointment of a new Governor at the end of the current term in September, with external appointments being the most likely candidates. An increase in longer-term Australian market-implied inflation expectations was another notable development, with both long-term (e.g., 5y5y forward) inflation breakevens and inflation swaps rising to fresh cycle highs. One reason attributed to this rise has been increased demand for inflation-linked bonds (ILBs) following news that the Government has selected the Bloomberg AusBond Master and not the AusBond Composite as the preferred domestic fixed interest index under APRA’s Your Future, Your Super benchmarking framework. The primary difference is that the Ausbond Master includes both ILBs and credit floating rate notes. The decision has already received some criticism from fund managers due to the patchy liquidity in the ILB market and the AOFM’s previous reluctance to proactively increase issuance in that sector.
Credit markets
Throughout the quarter, credit markets proved resilient despite further rate hikes, ongoing macro uncertainty, and the shadow cast by the previous quarter’s banking crisis. The anticipated credit tightening from the US commercial banking sector did not materialise to the extent many had expected, with overall financial conditions not appearing particularly restrictive, as evidenced by the broad-based compression in credit spreads.
In the US, investment-grade spreads in the 5–10-year maturity bracket compressed by around 10 basis points, finishing the quarter at approximately +140 basis points over Treasuries. Concurrently, high-yield spreads narrowed by an average of 50 basis points to around +400 basis points, with the final level of spreads largely consistent with a soft-landing outcome.
This compression in spreads occurred despite an uptick in US corporate bankruptcies, which reached their highest levels since 2010. In addition, corporate issuance remained robust during this period, with gross investment-grade sales reaching US$320 billion, a 12% increase from Q2 of the previous year (Bloomberg), and high-yield issuance showing similar resilience. Despite the growing incidence of credit stress and robust volume of issuance, risk sentiment towards credit markets remained positive, bolstered by buoyant equity markets and moderating interest rate volatility.
In Australia, credit spreads reflected the robustness of their USD equivalents, with Investment Grade spreads compressing by around 20 basis points on average. This was supported by a compression in AUD swap spreads as Commonwealth government bonds lost their scarcity premium due to the ongoing unwinding of the effects of Quantitative Easing and speculation around the prospect of an accelerated balance sheet run off emerged. AUD corporate issuance picked up over the June quarter, and while issuance among banks remained strong, the most notable development was the flurry of non-financial corporate issuance, with utilities and automakers returning to the market in size.
Outlook
As we step into Q3, bond yields across developed markets have hit or are nearing fresh cycle highs. This adjustment is driven by two realisations among market participants. Firstly, a “pause” in rate hikes, as exemplified by the RBA and Bank of Canada, does not necessarily signal the end of hikes, a fact that the Fed’s guidance also underscores. Secondly, the current policy setting, and overall financial conditions may not be tight enough to promptly impact economic activity and inflation pressures. This may necessitate terminal rates climbing above 5% in Australia, 6% in the US, and 7% in the UK. Labour market strength across developed economies will be a key determinant of these terminal rates. So far, despite the tightest monetary policy in a generation, we have yet to see major disruptions in employment or wages growth.
Market narratives remain fluid. The once prominent recession/hard landing perspective has now been replaced by both the “soft-landing” and “no landing” themes. Underlying these shifts, however, is a growing concern about economic growth relative to inflation fears, as evidenced by the resurfacing negative correlation between stocks and bonds. The tension between softening leading indicators and the strength of hard economic data will likely continue to steer these narratives.
It is, however, notable that with respect to economic resilience, the rates market, rather than central banks, was furthest behind the curve. The banking stress of Q1 emboldened recession expectations, with the Fed’s own dot plot in March seen as overly hawkish. Yet, it has been central bank guidance, which continues to be revised in an ever more hawkish direction, that has been vindicated, with the rates market having to play catch up, with all the 2023 cuts now priced out of the market and most of the 2024 cuts being removed. The fact that some rate cuts are still priced in for next year remains a risk to the US bond market going forward, and arguably the biggest bearish catalyst might not be where terminal policy rates get to, but rather prolonged economic resilience justifying higher long-term neutral rate estimates.
Just how tight the financial conditions currently are is an ongoing question, but there is a compelling argument that they are still too accommodating. This is evidenced by the mechanical easing in financial conditions indices following the strength in risk assets and the compression of implied volatility and risk premiums. Further evidence includes robust corporate issuance that has persisted throughout much of the year and the resilience of labour markets and the housing sector, despite much higher interest rates. The counter to this view is that we simply need to allow for the “long and variable” lags of policy cycles to unfold. Lags have always been a feature of policy cycles, but there’s a strong case that the lag might be even longer this time around. This is due to the terming out of corporate and household debt in the US in the immediate post-Covid period. The Fed’s multi-dimensional view of the tightening cycle—comprising speed, level, and duration—implies that even if the hiking cycle ends soon, the effective tightening might continue well beyond the peak in rates.
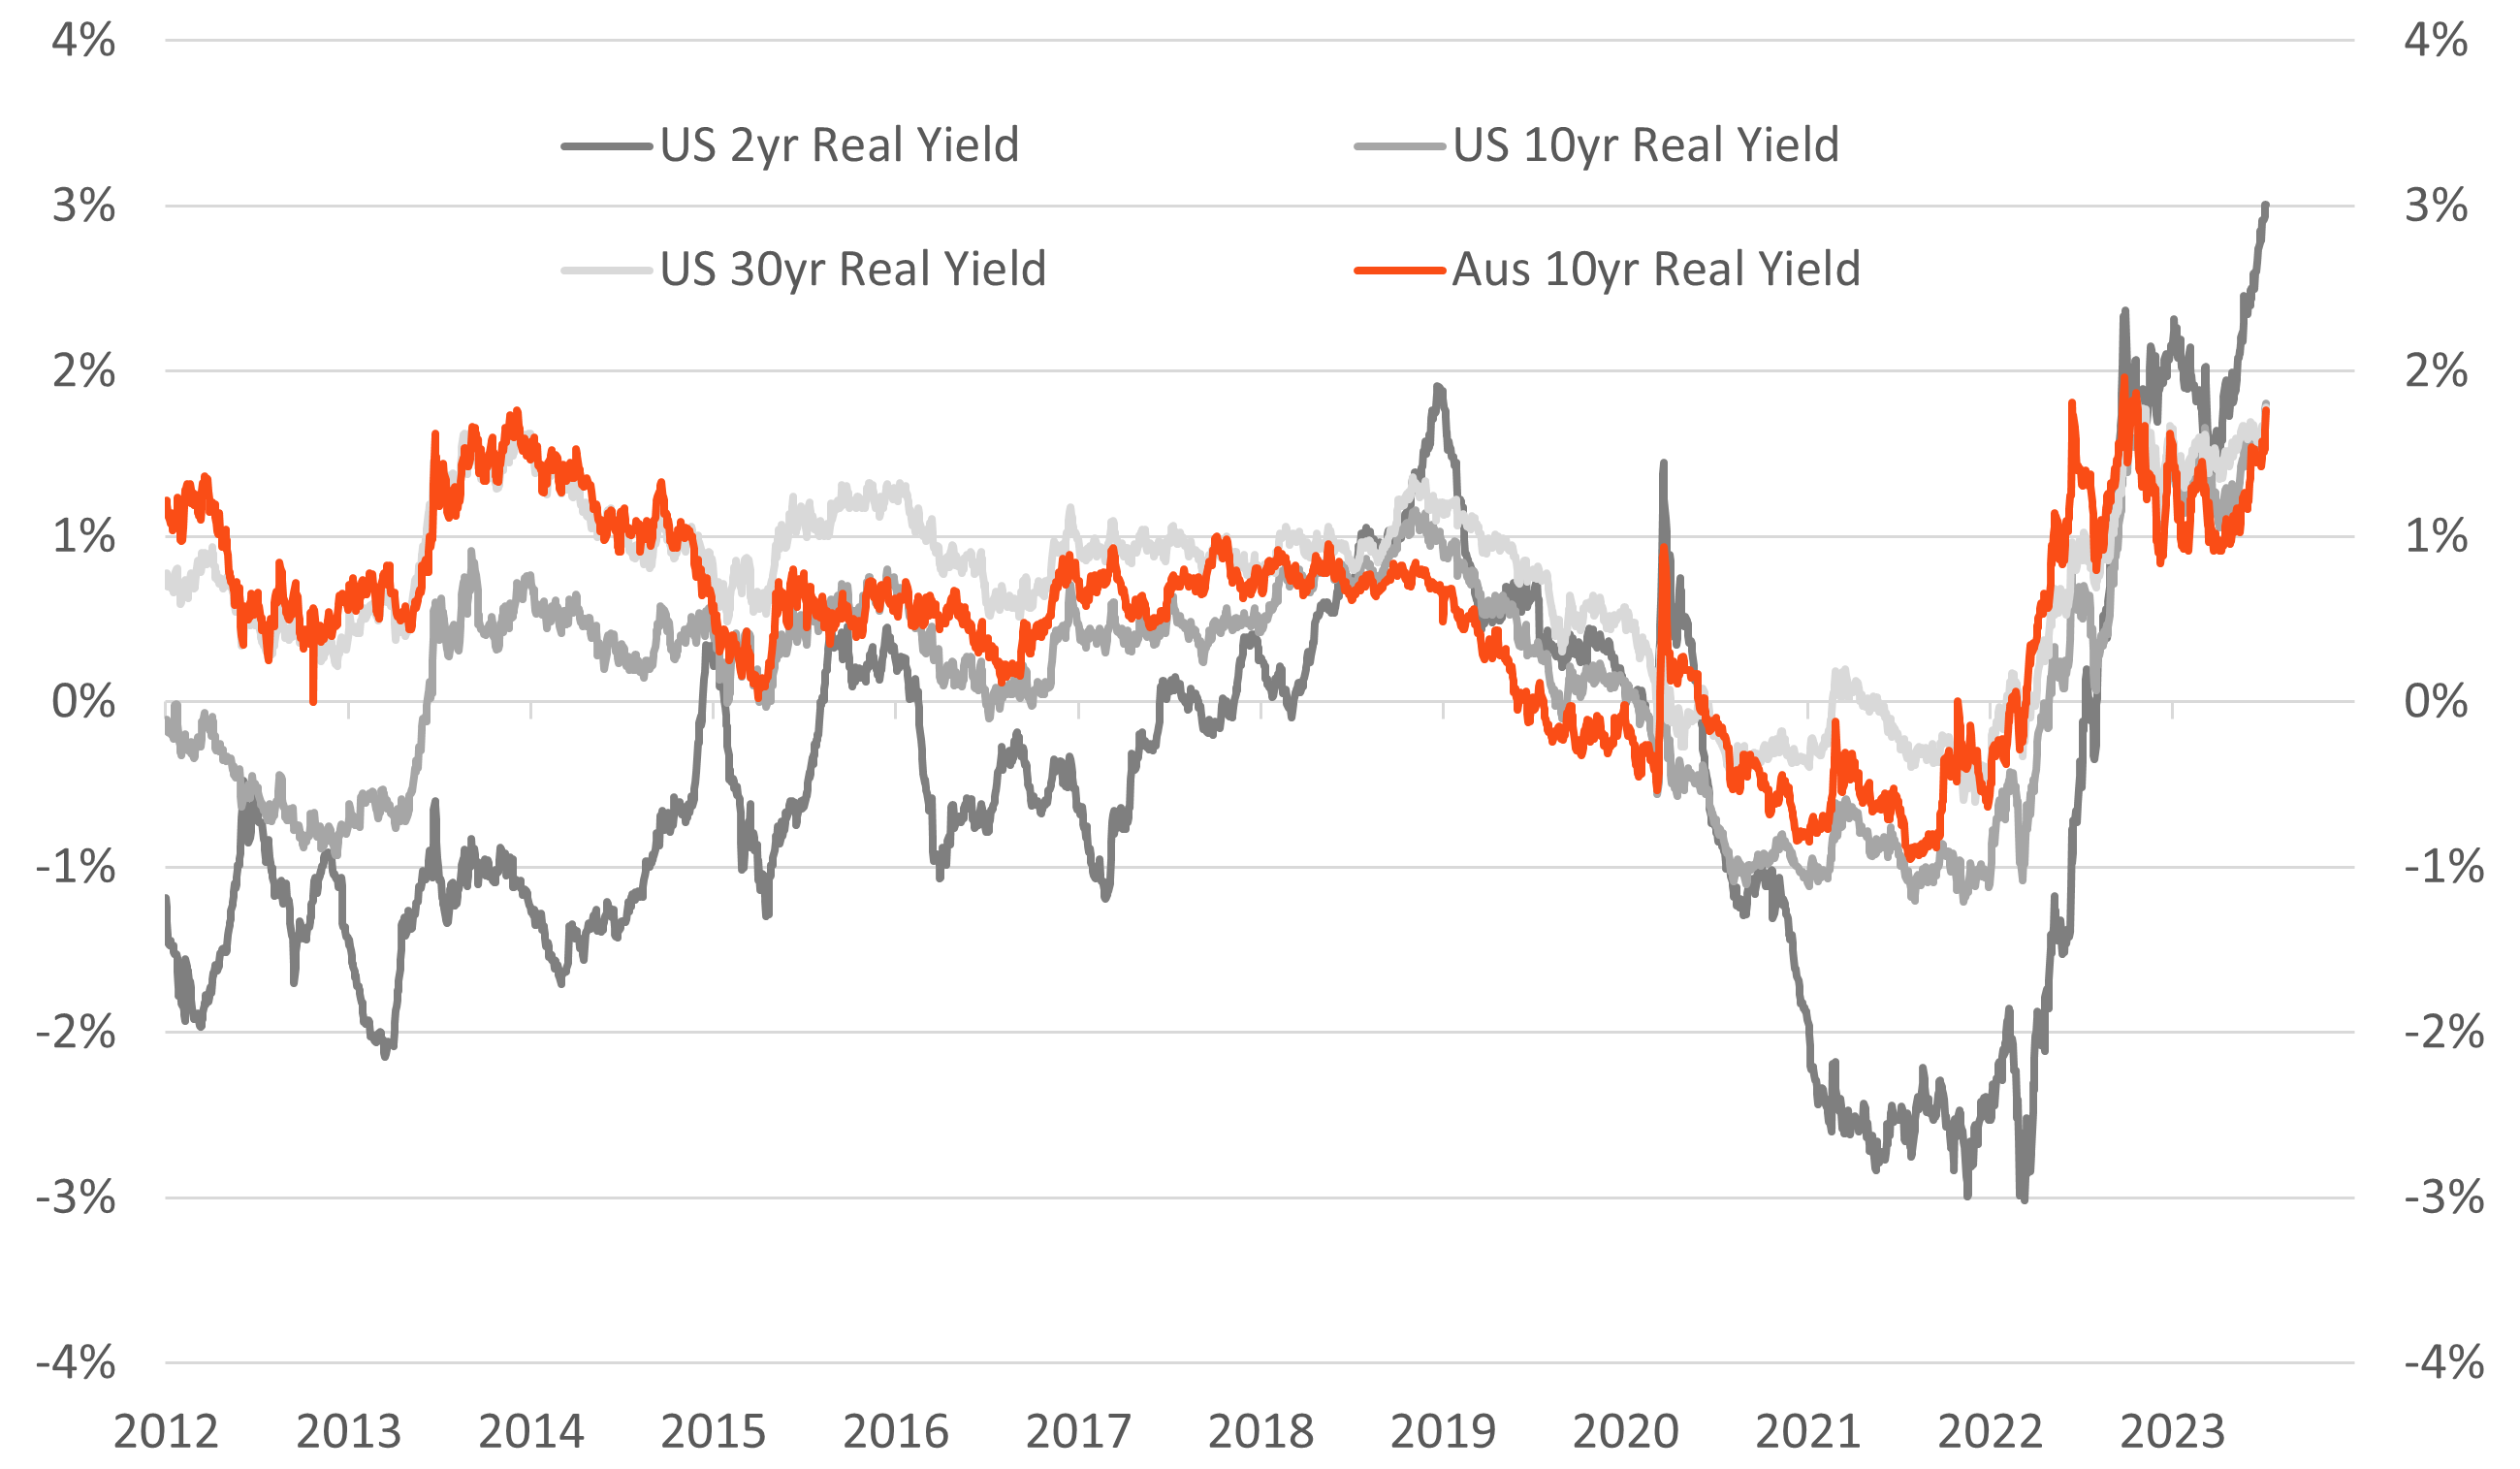
Finally, on the topic of asset allocation, discretionary managers started the year with a conservative stance due to perceived US recession risks. However, a combination of better-than-expected data and the resurgence of equities has led to the unwinding of recession trades. Yet, with real yields reaching fresh cycle highs in both Australia and the US, investors now have viable alternatives to equities, especially considering the aim of the current global tightening cycle is effectively to undermine nominal demand, which by extension should translate to weaker corporate profits.
Chart 1: G7 + Australasia Policy Rates, as at 30-June-2023; Source: Bloomberg
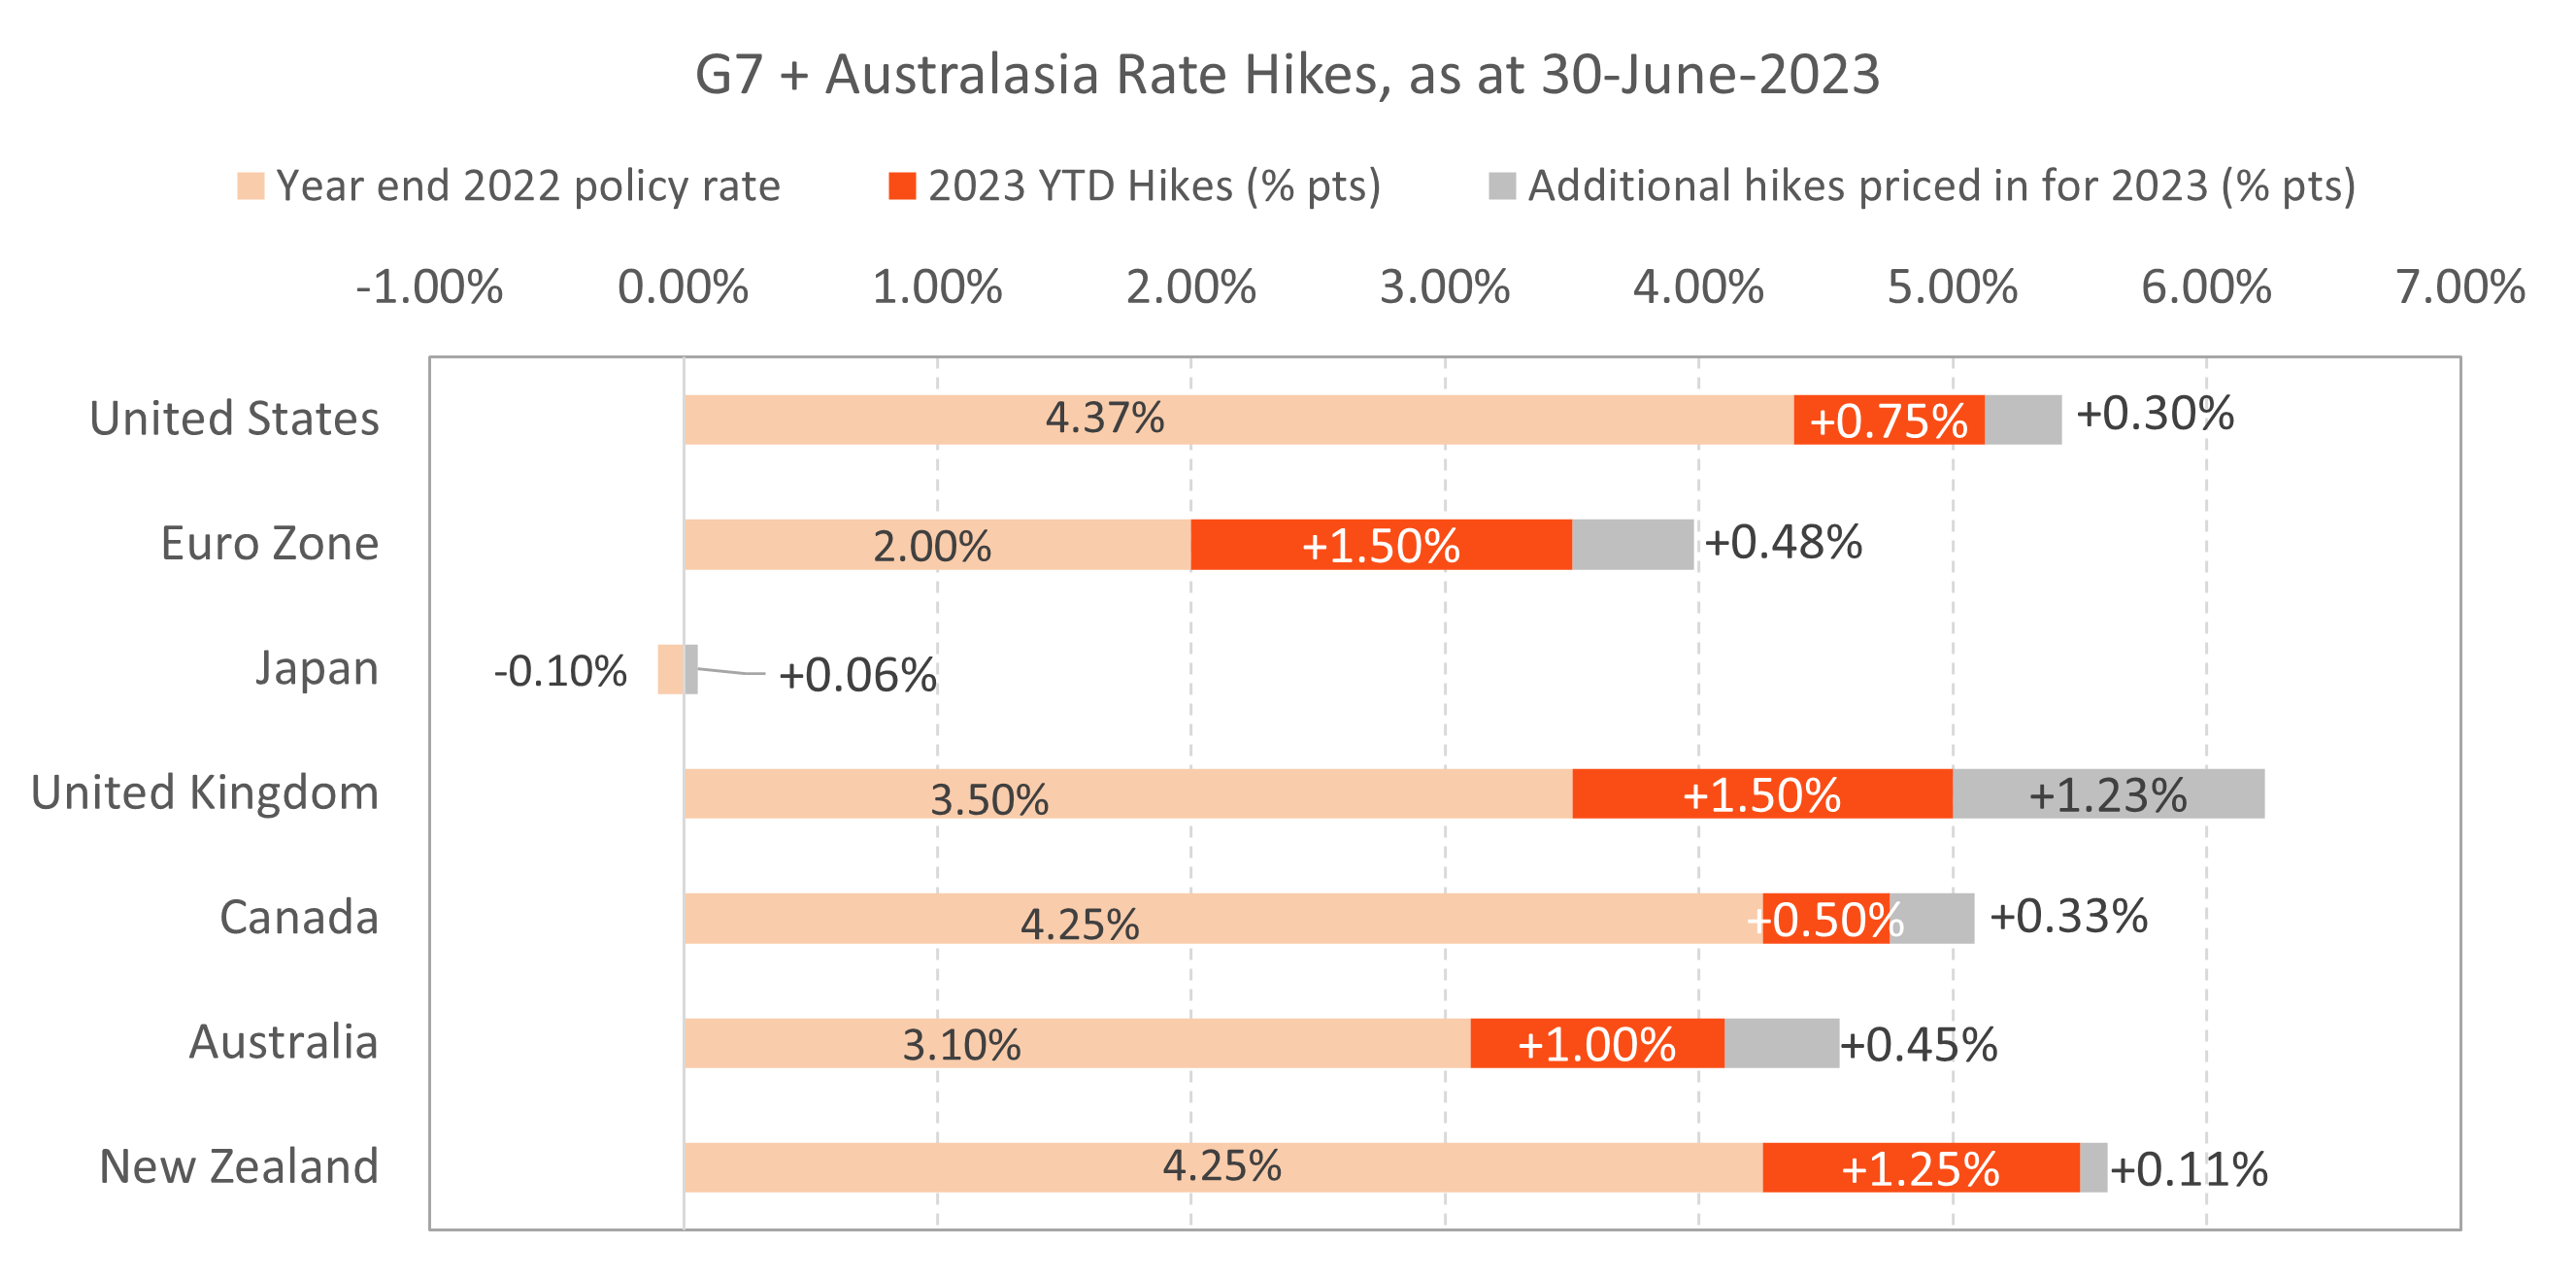
Chart 2: Global economic surprises, as at 30-June-2023; Source: Citi
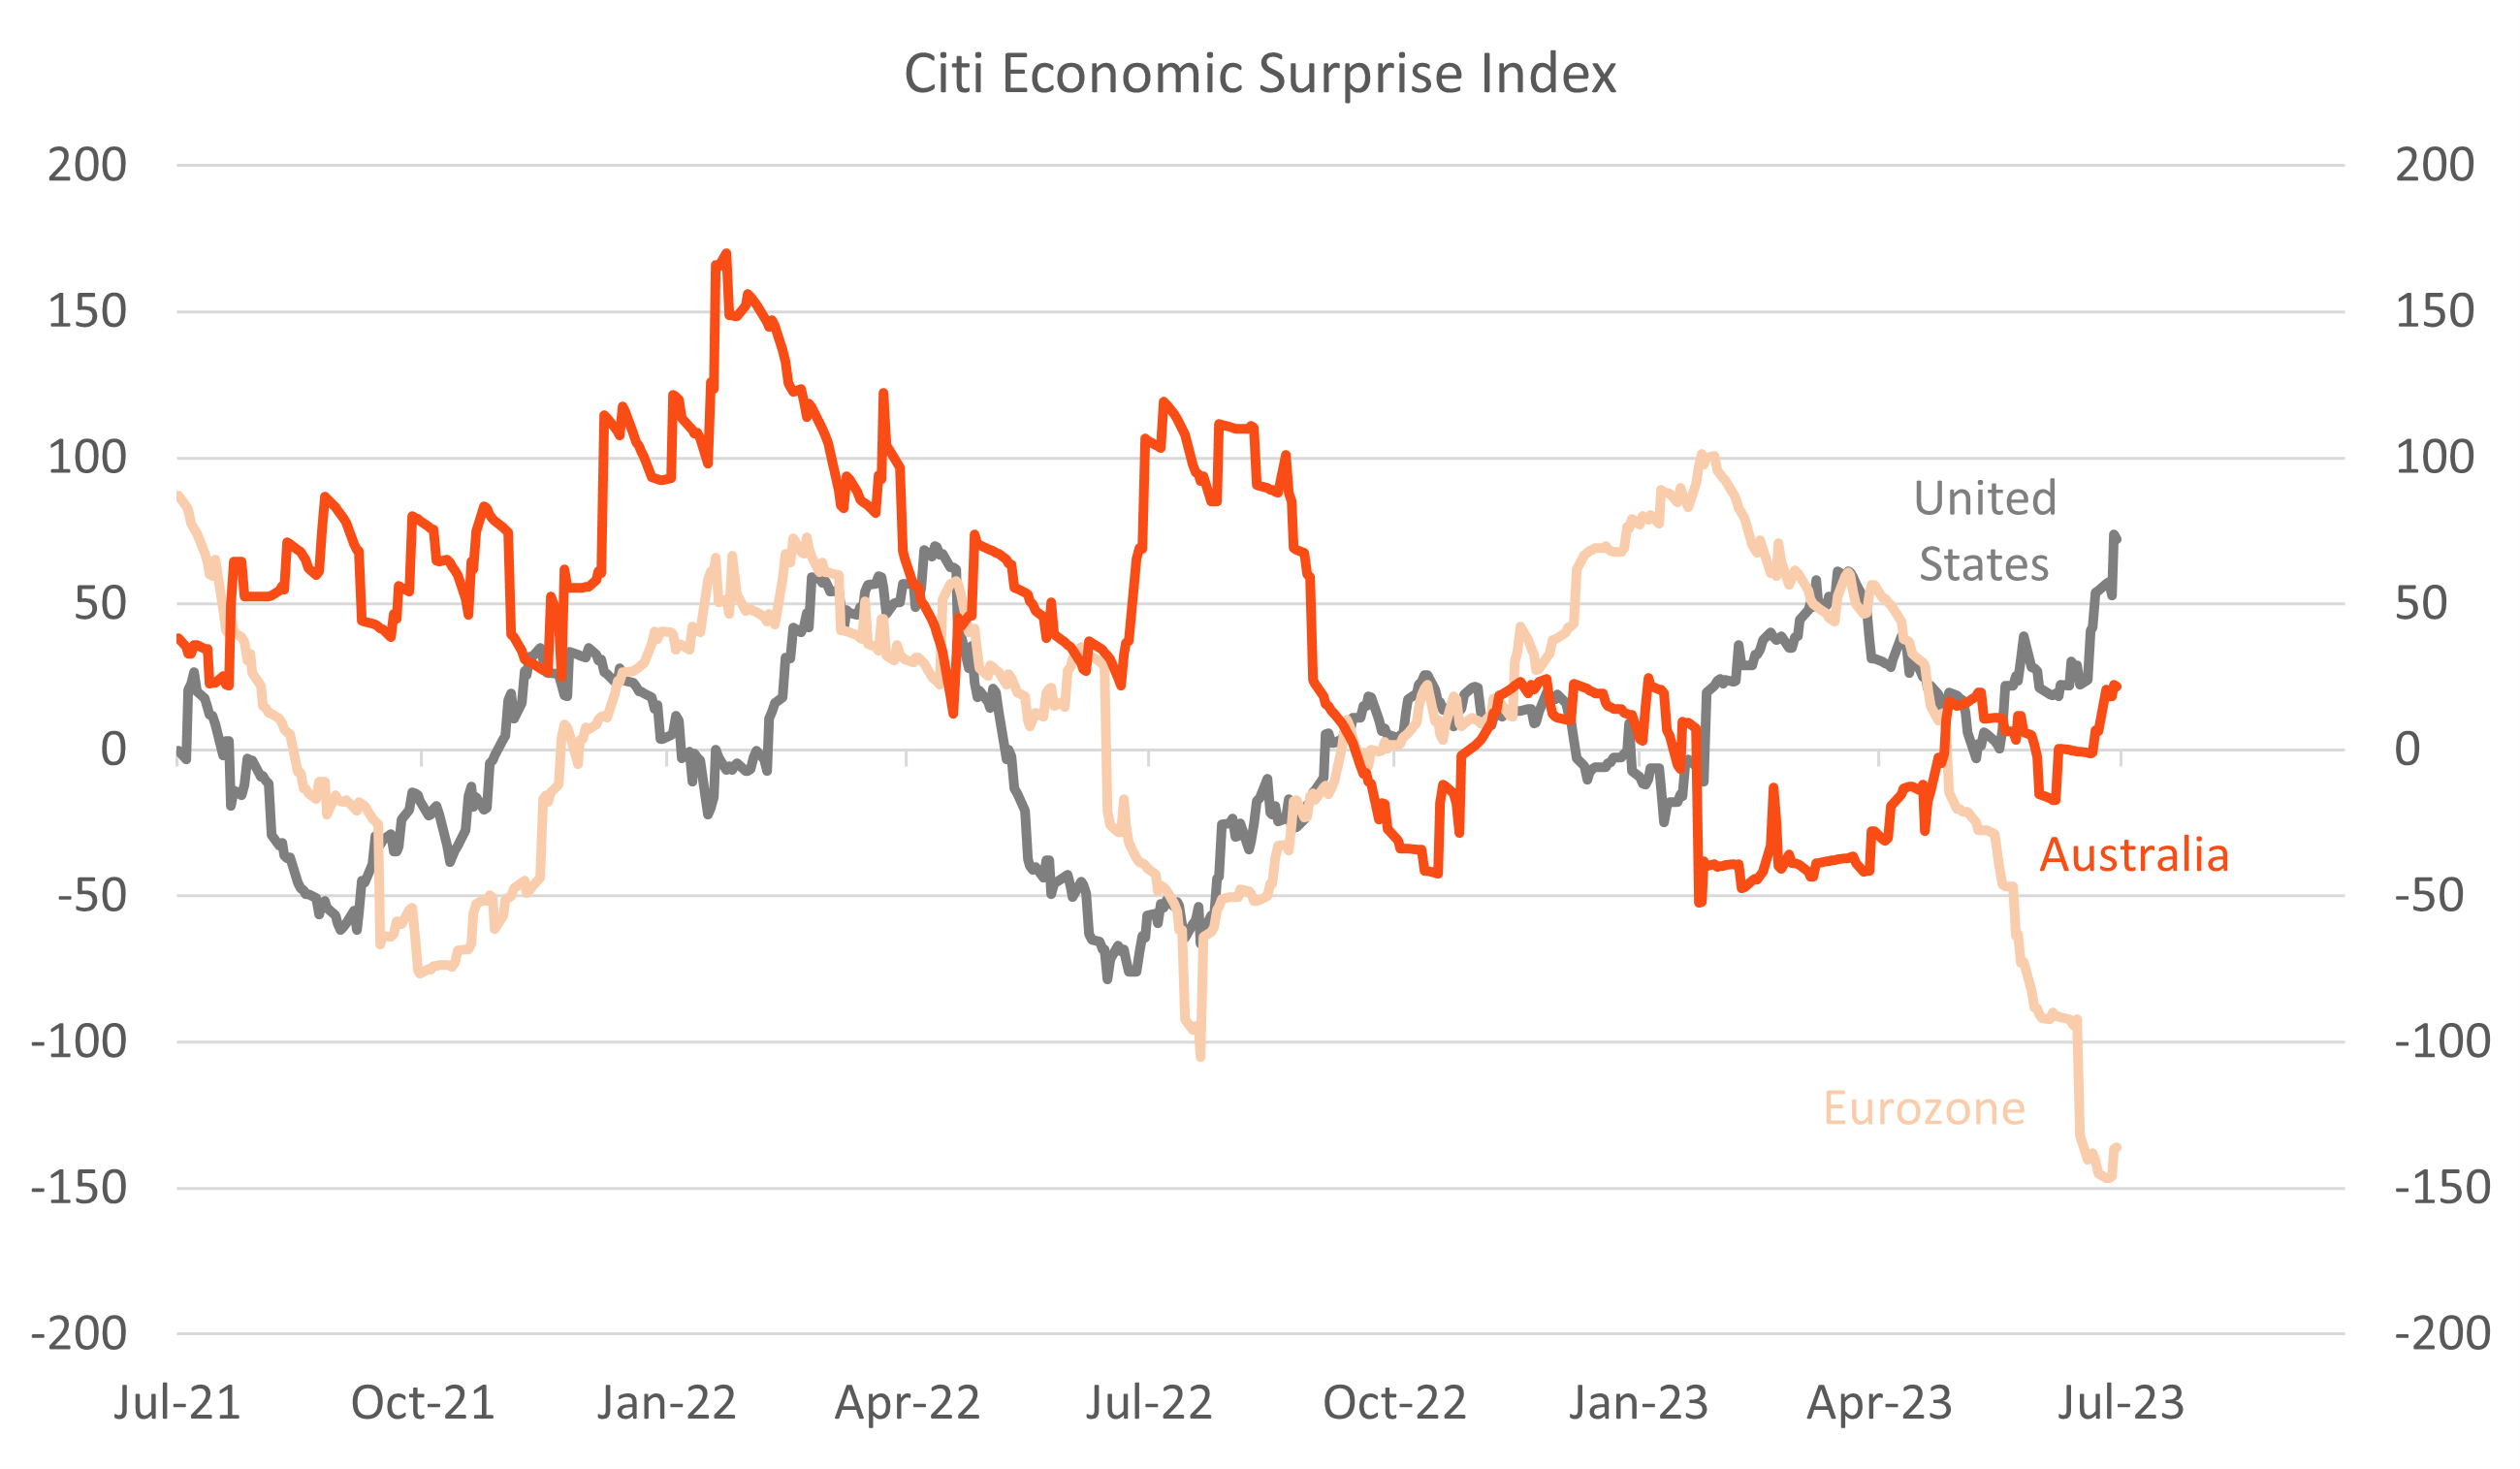
Chart 3: US interest rates, as at 30-June-2023; Source: Bloomberg
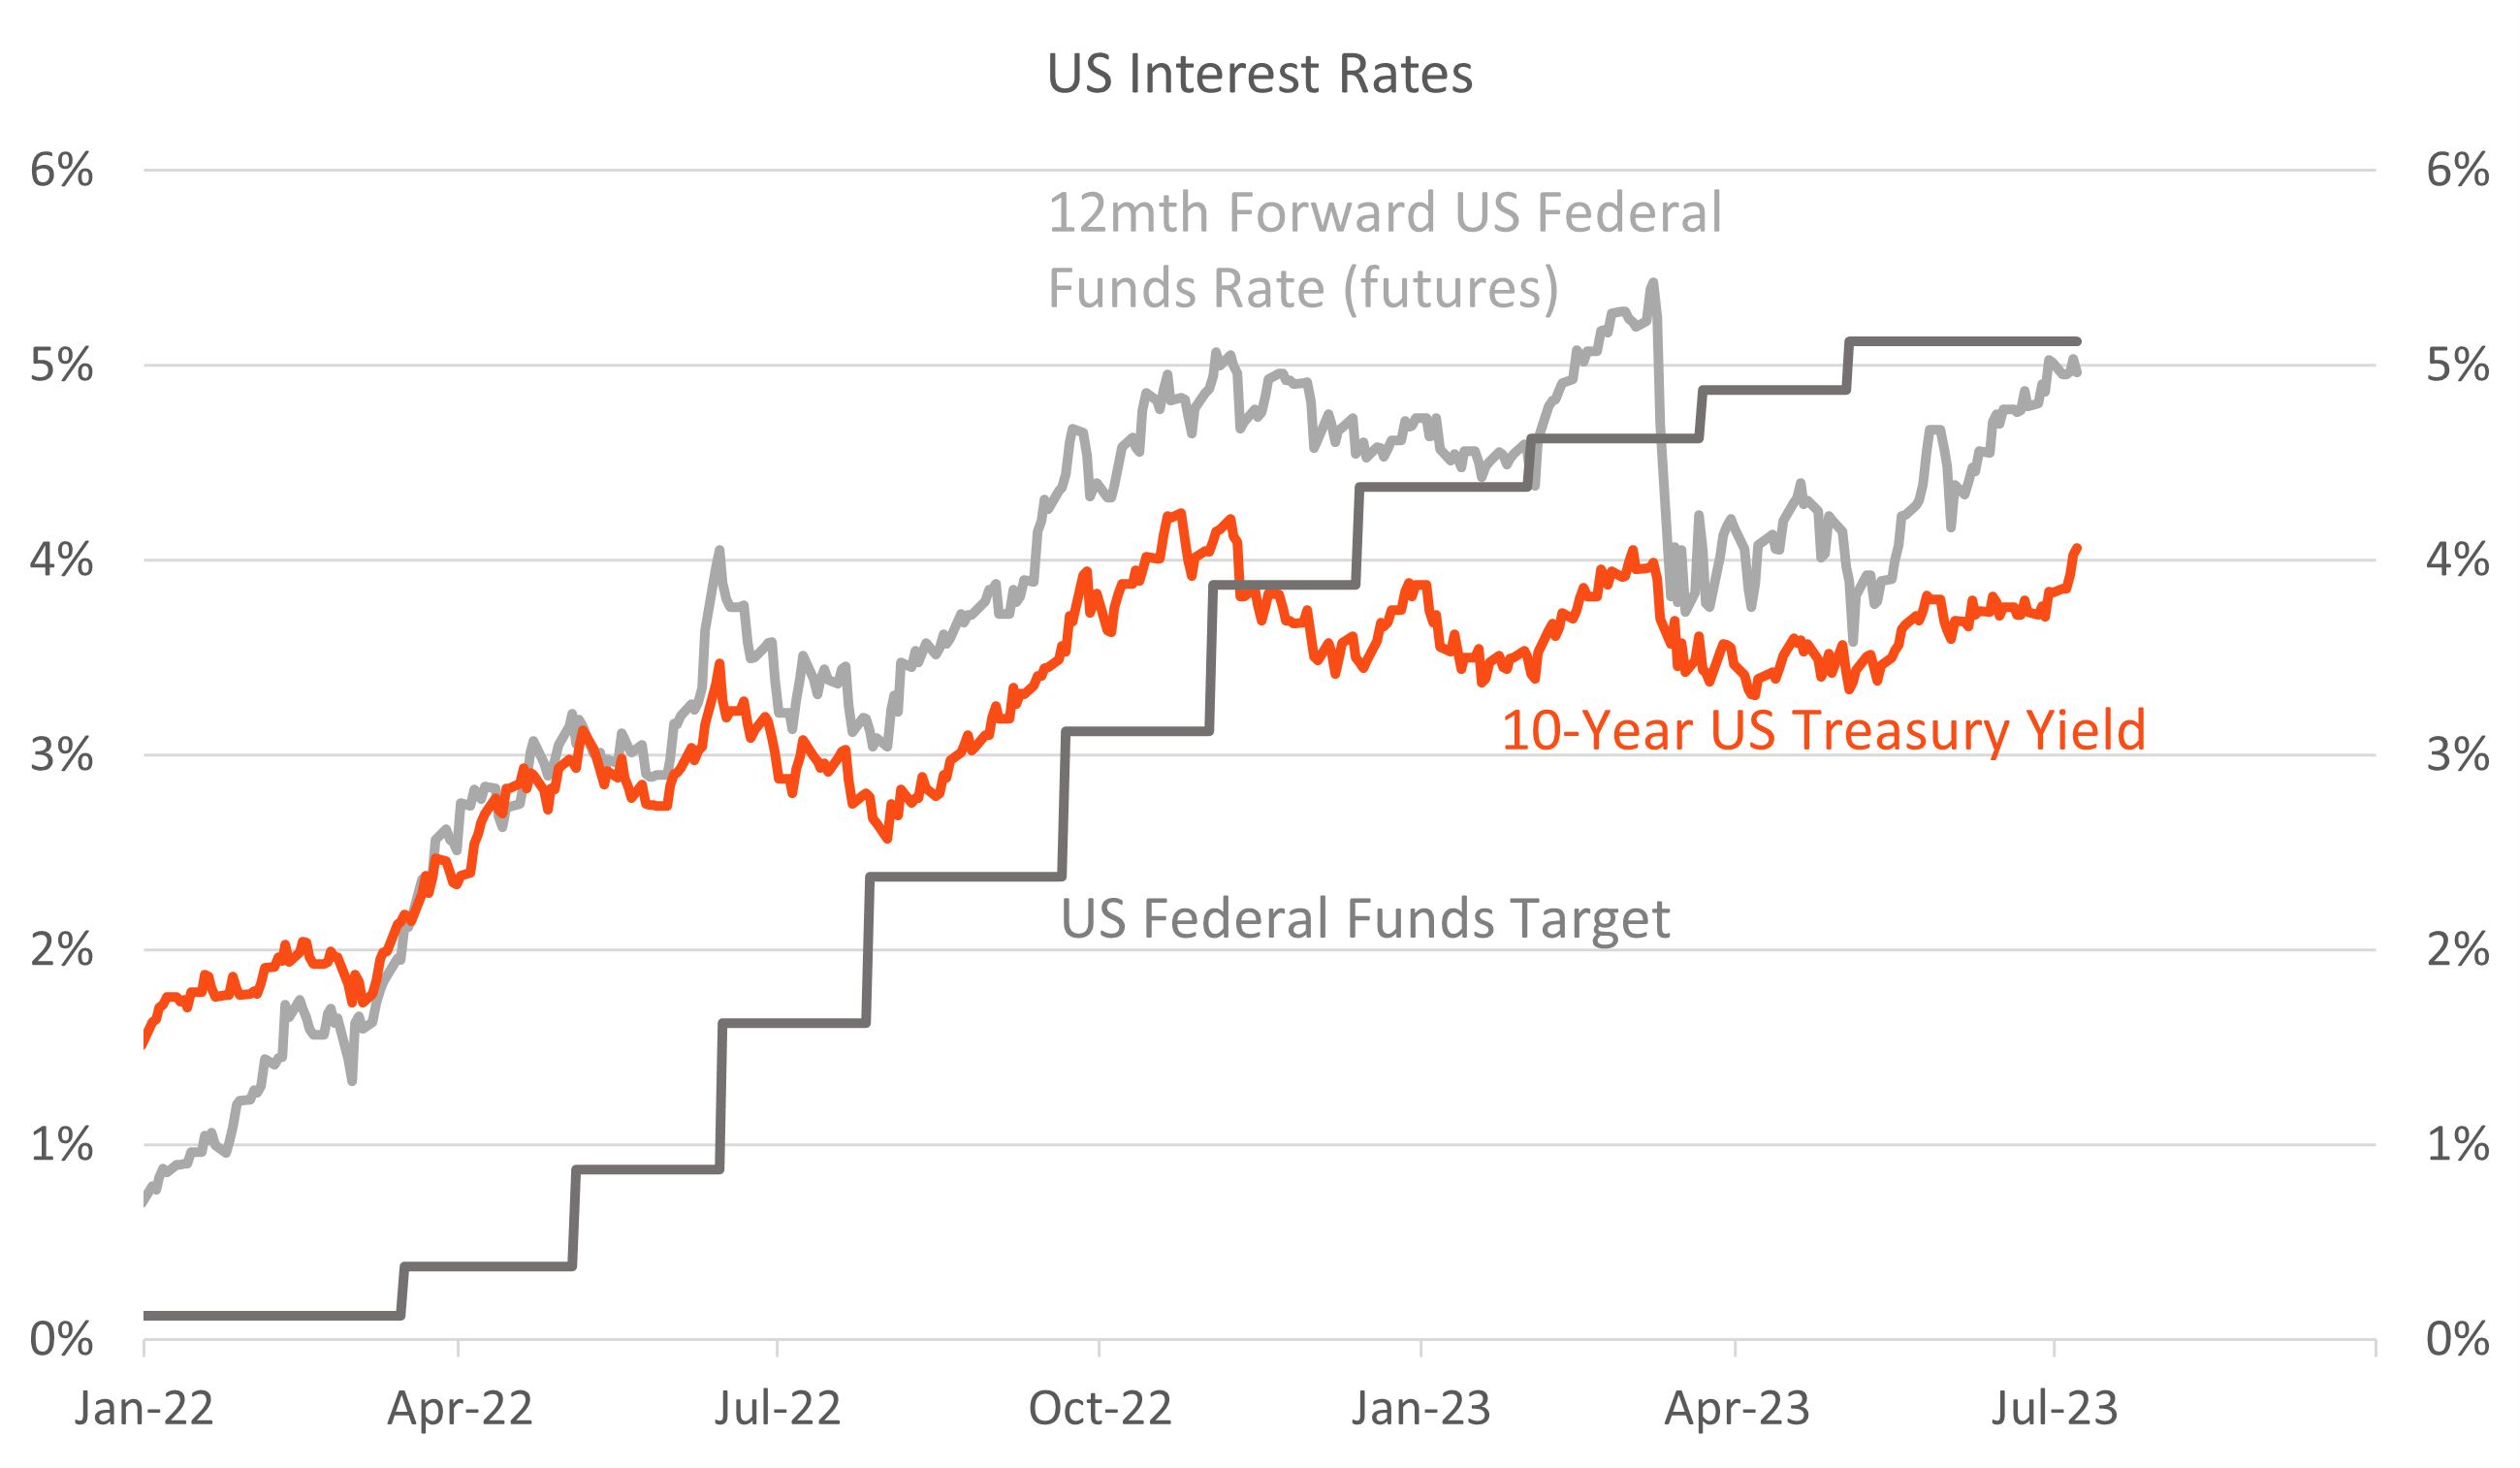
Chart 4: Australian interest rates, as at 30-June-2023; Source; Bloomberg
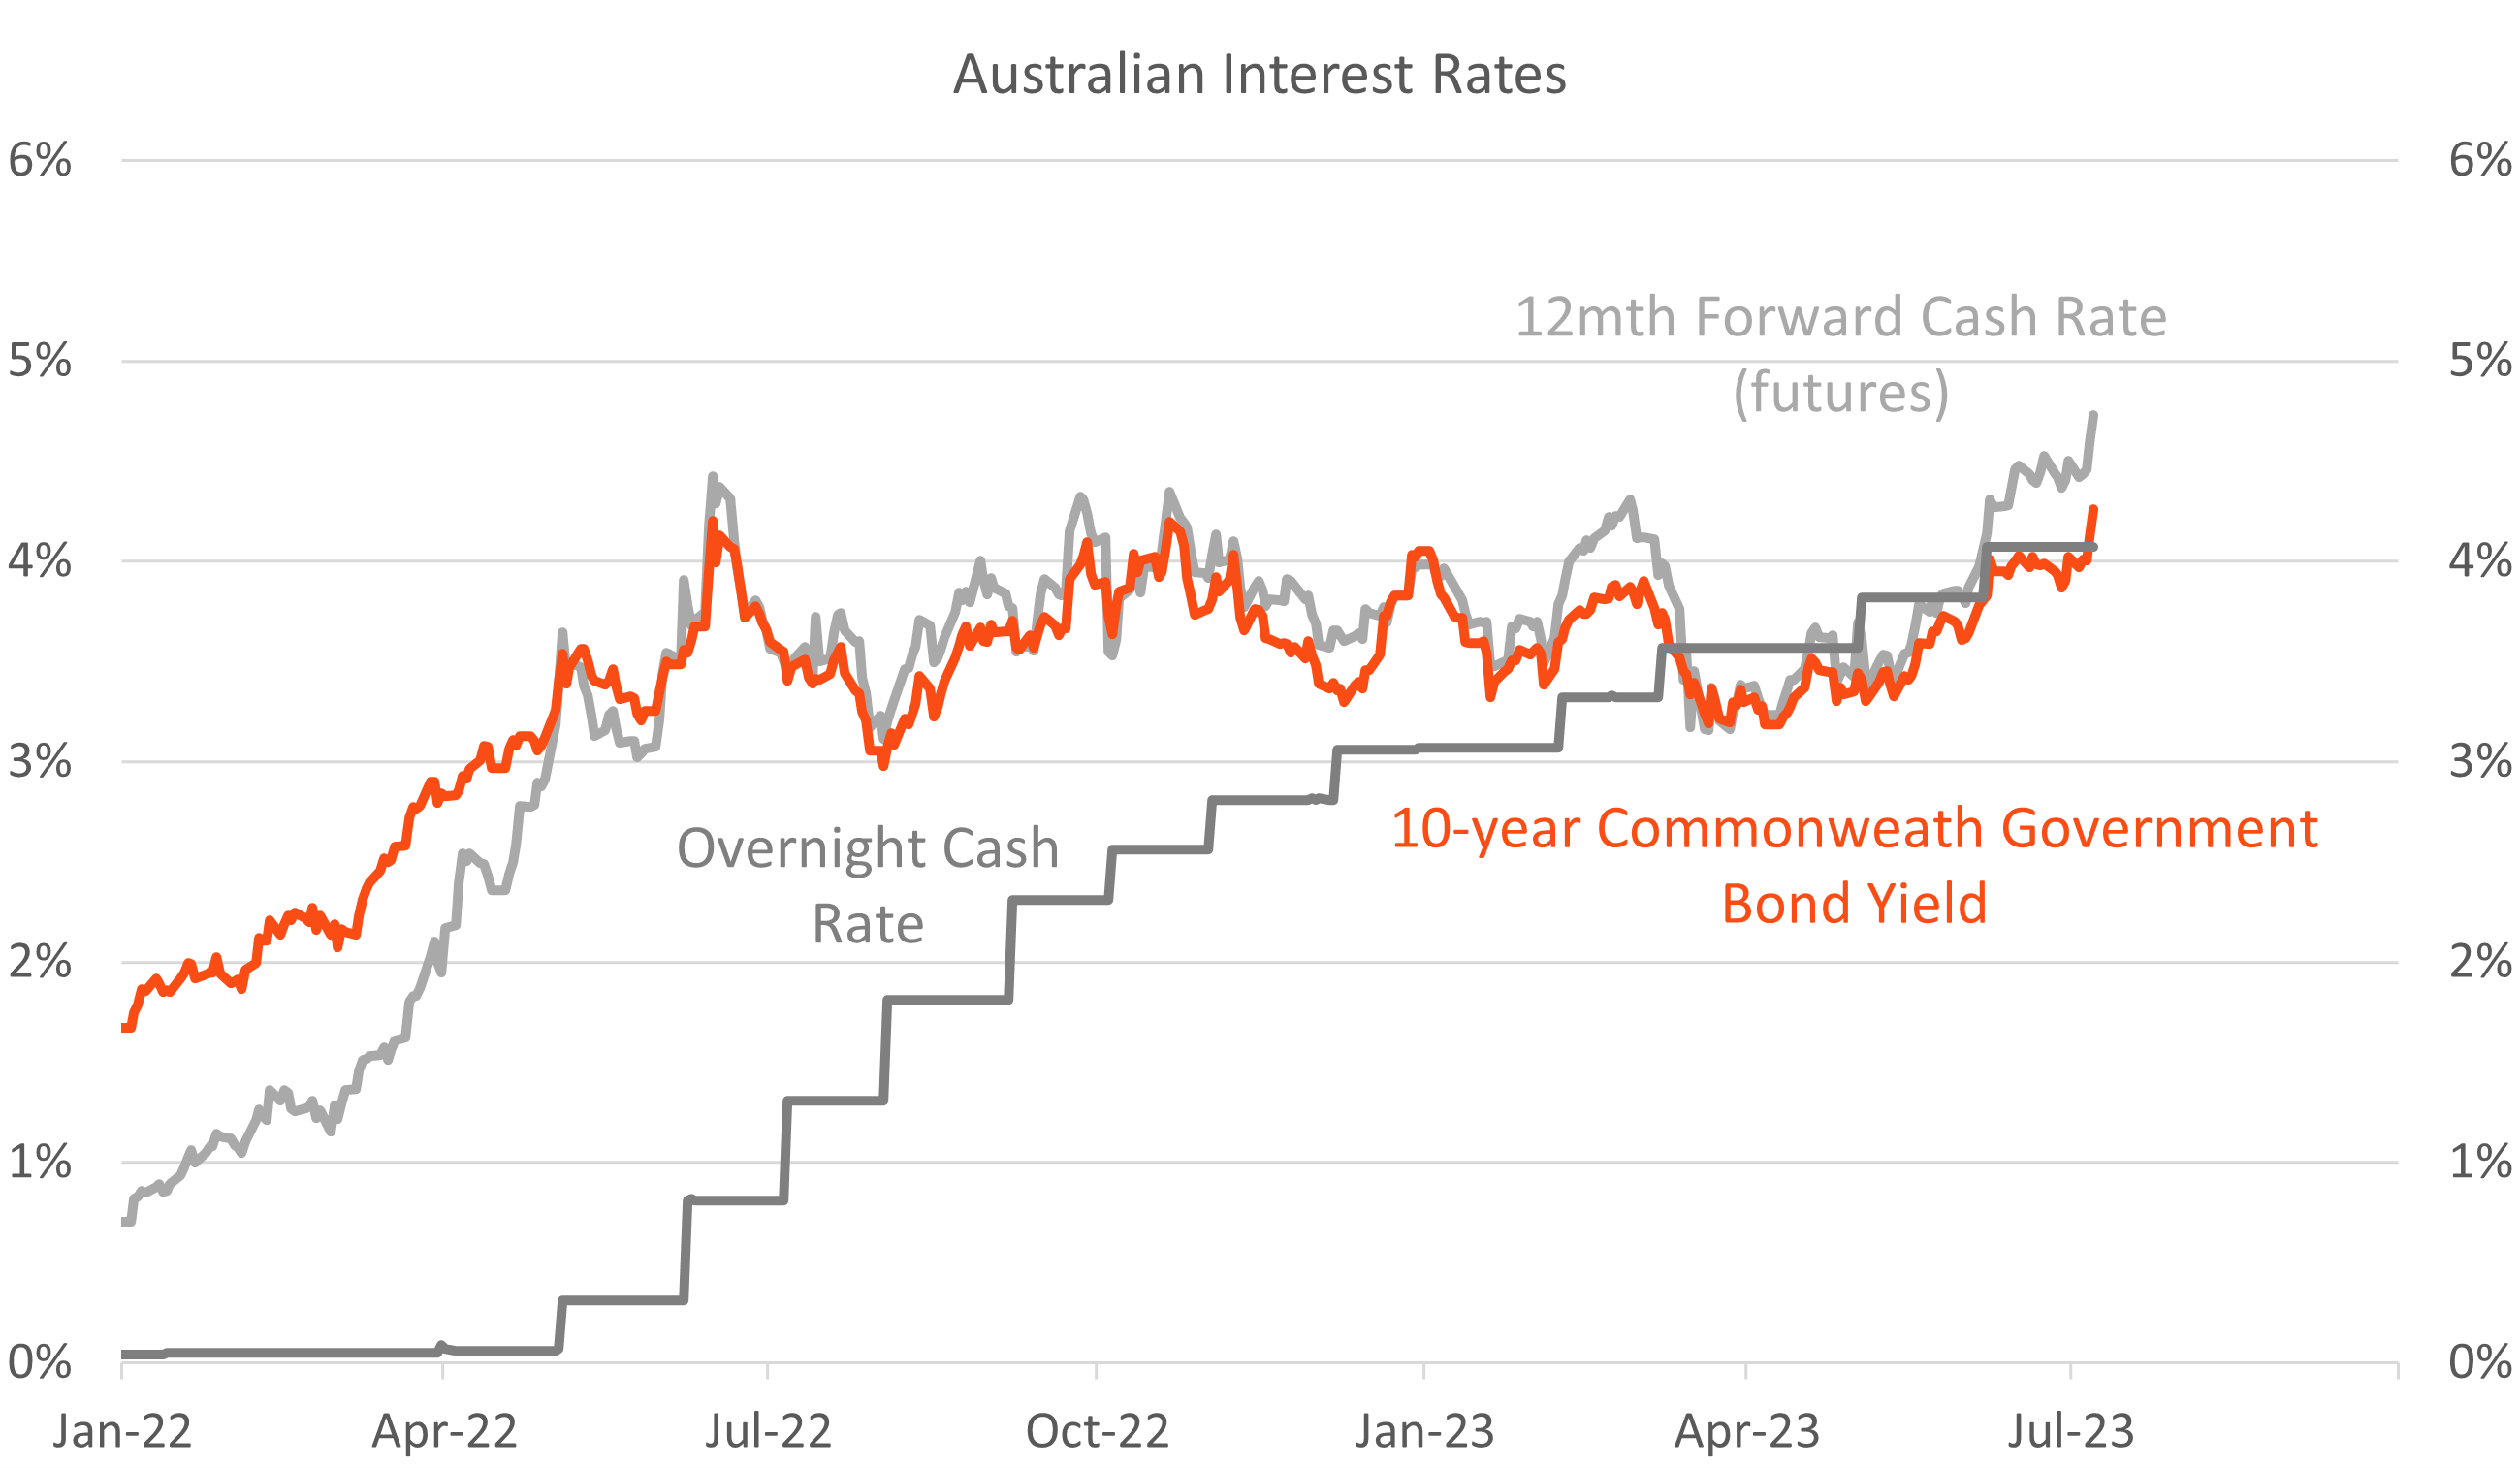
Chart 5: Corporate bond spreads; as at 30-June-2023; Source: Bloomberg
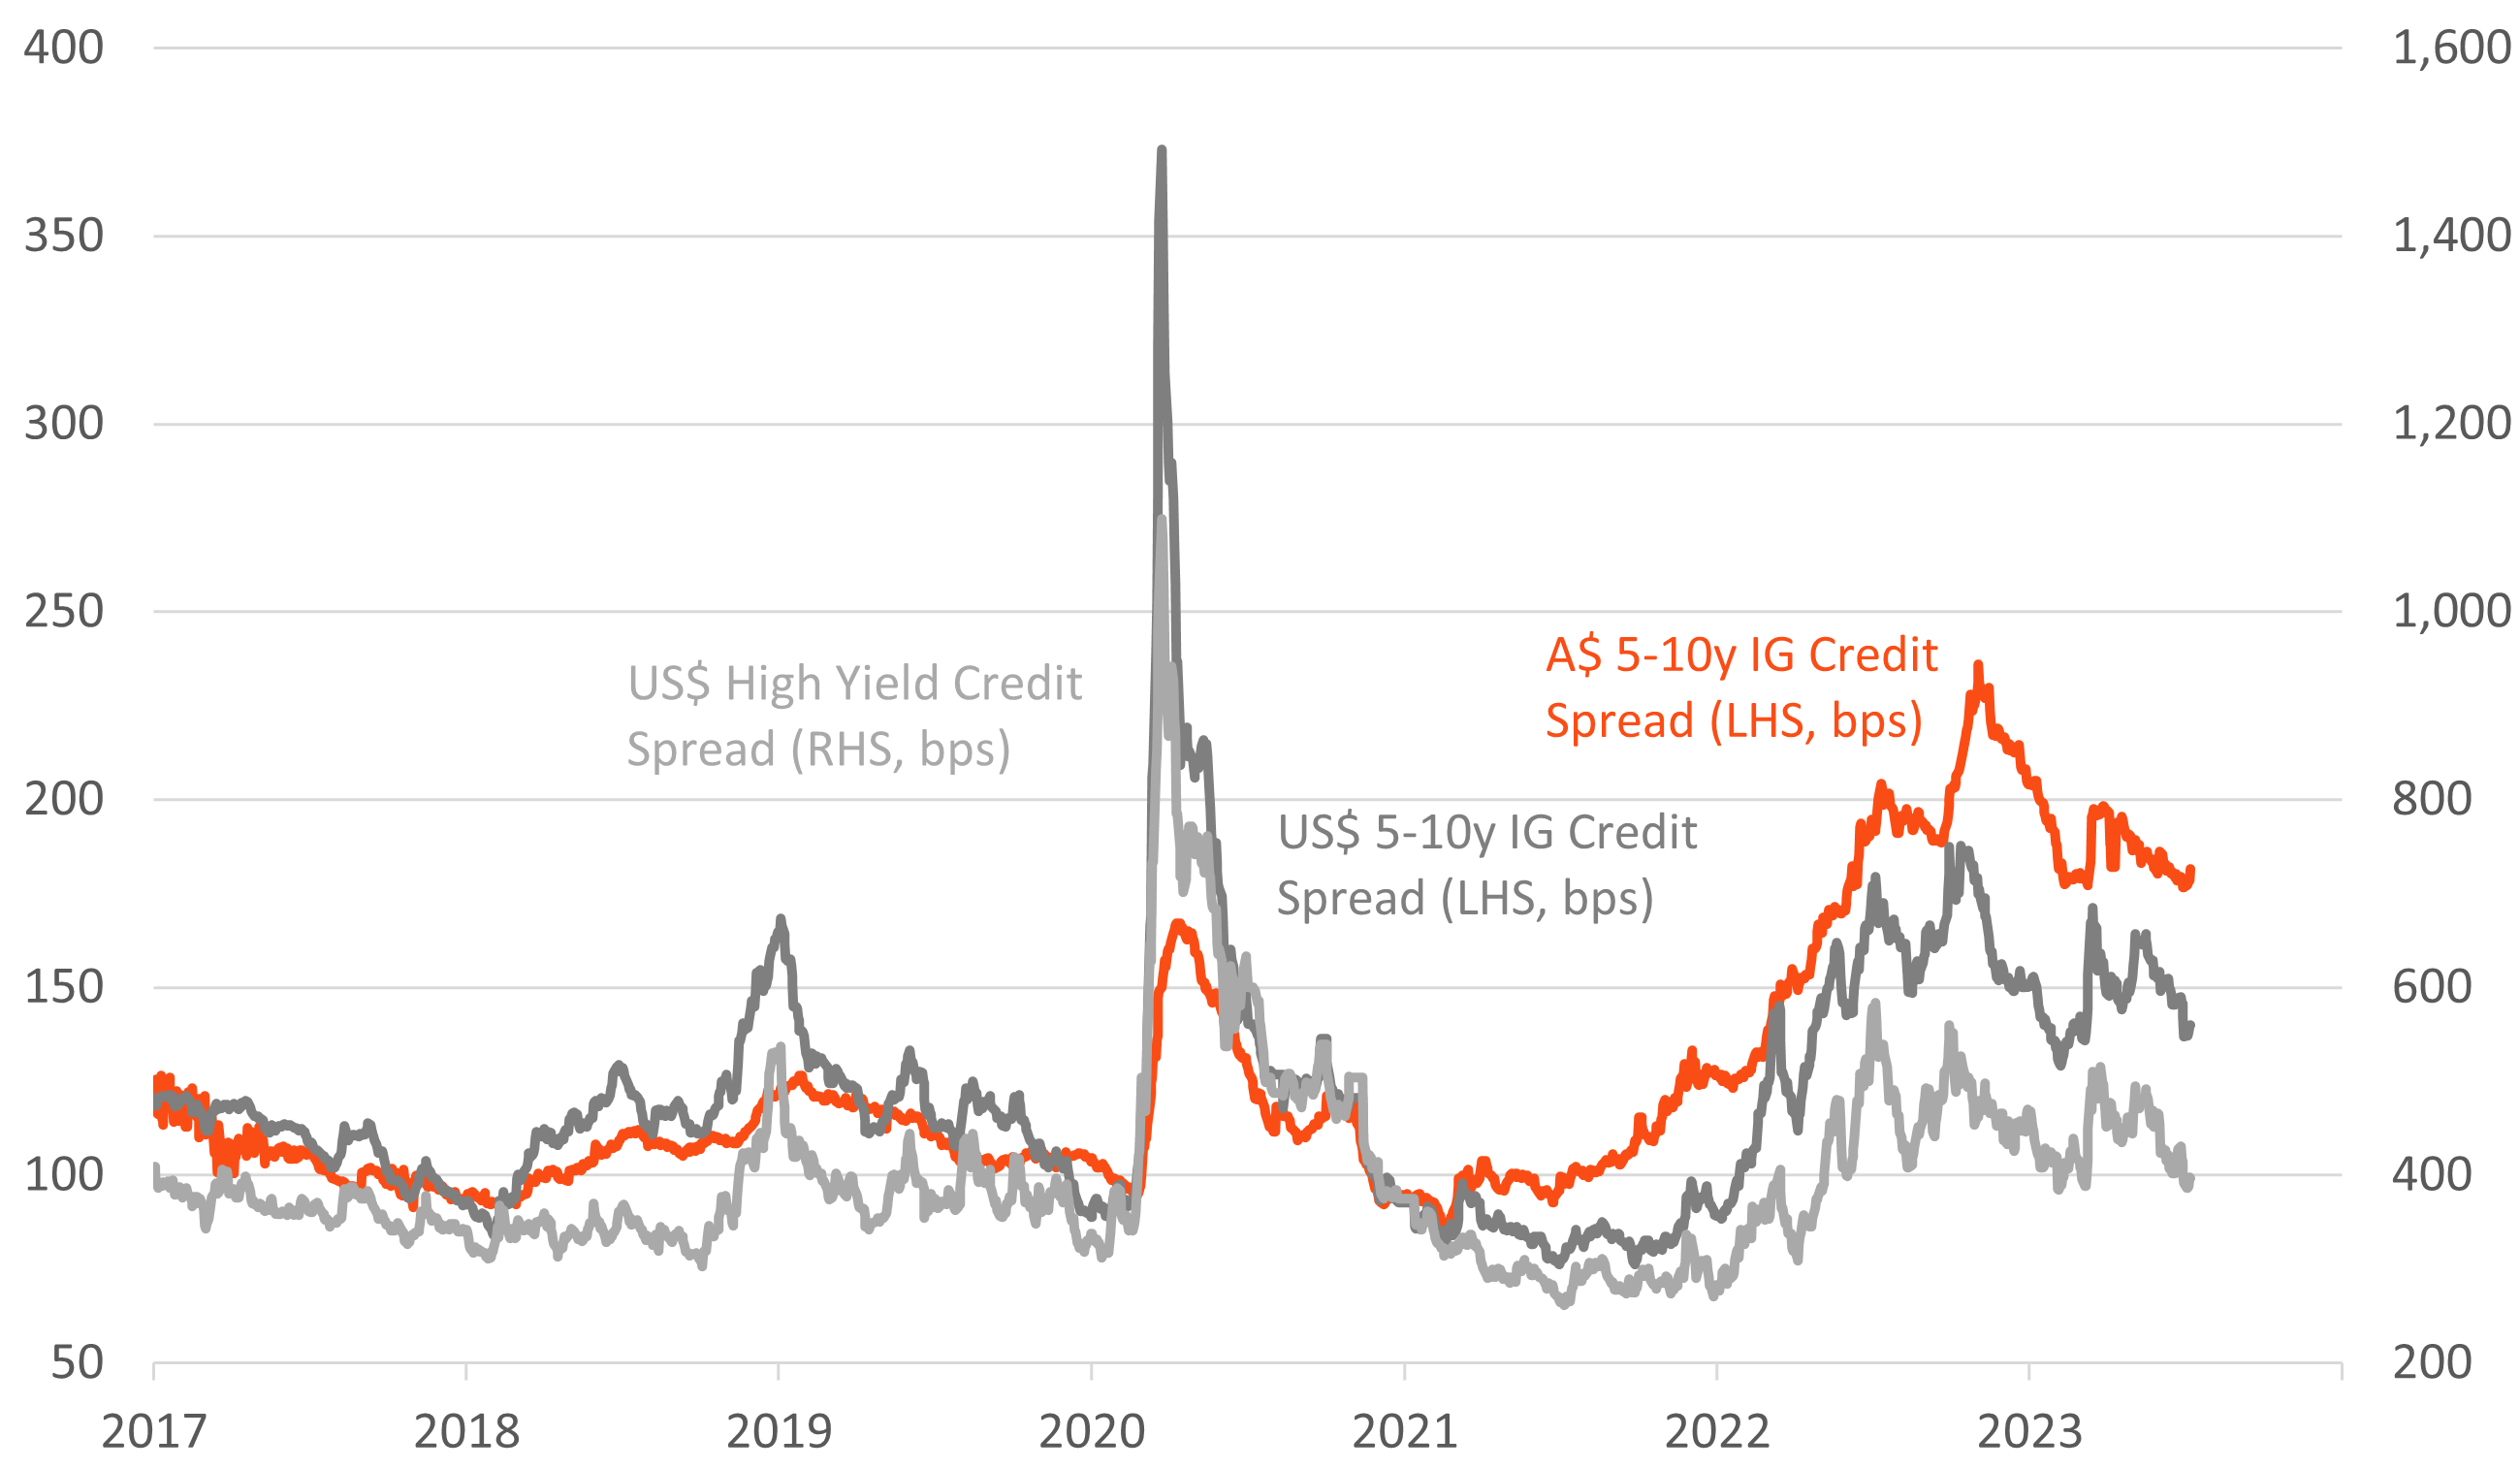
Chart 6: USD gross corporate bond issuance (US$b); Source: Bloomberg
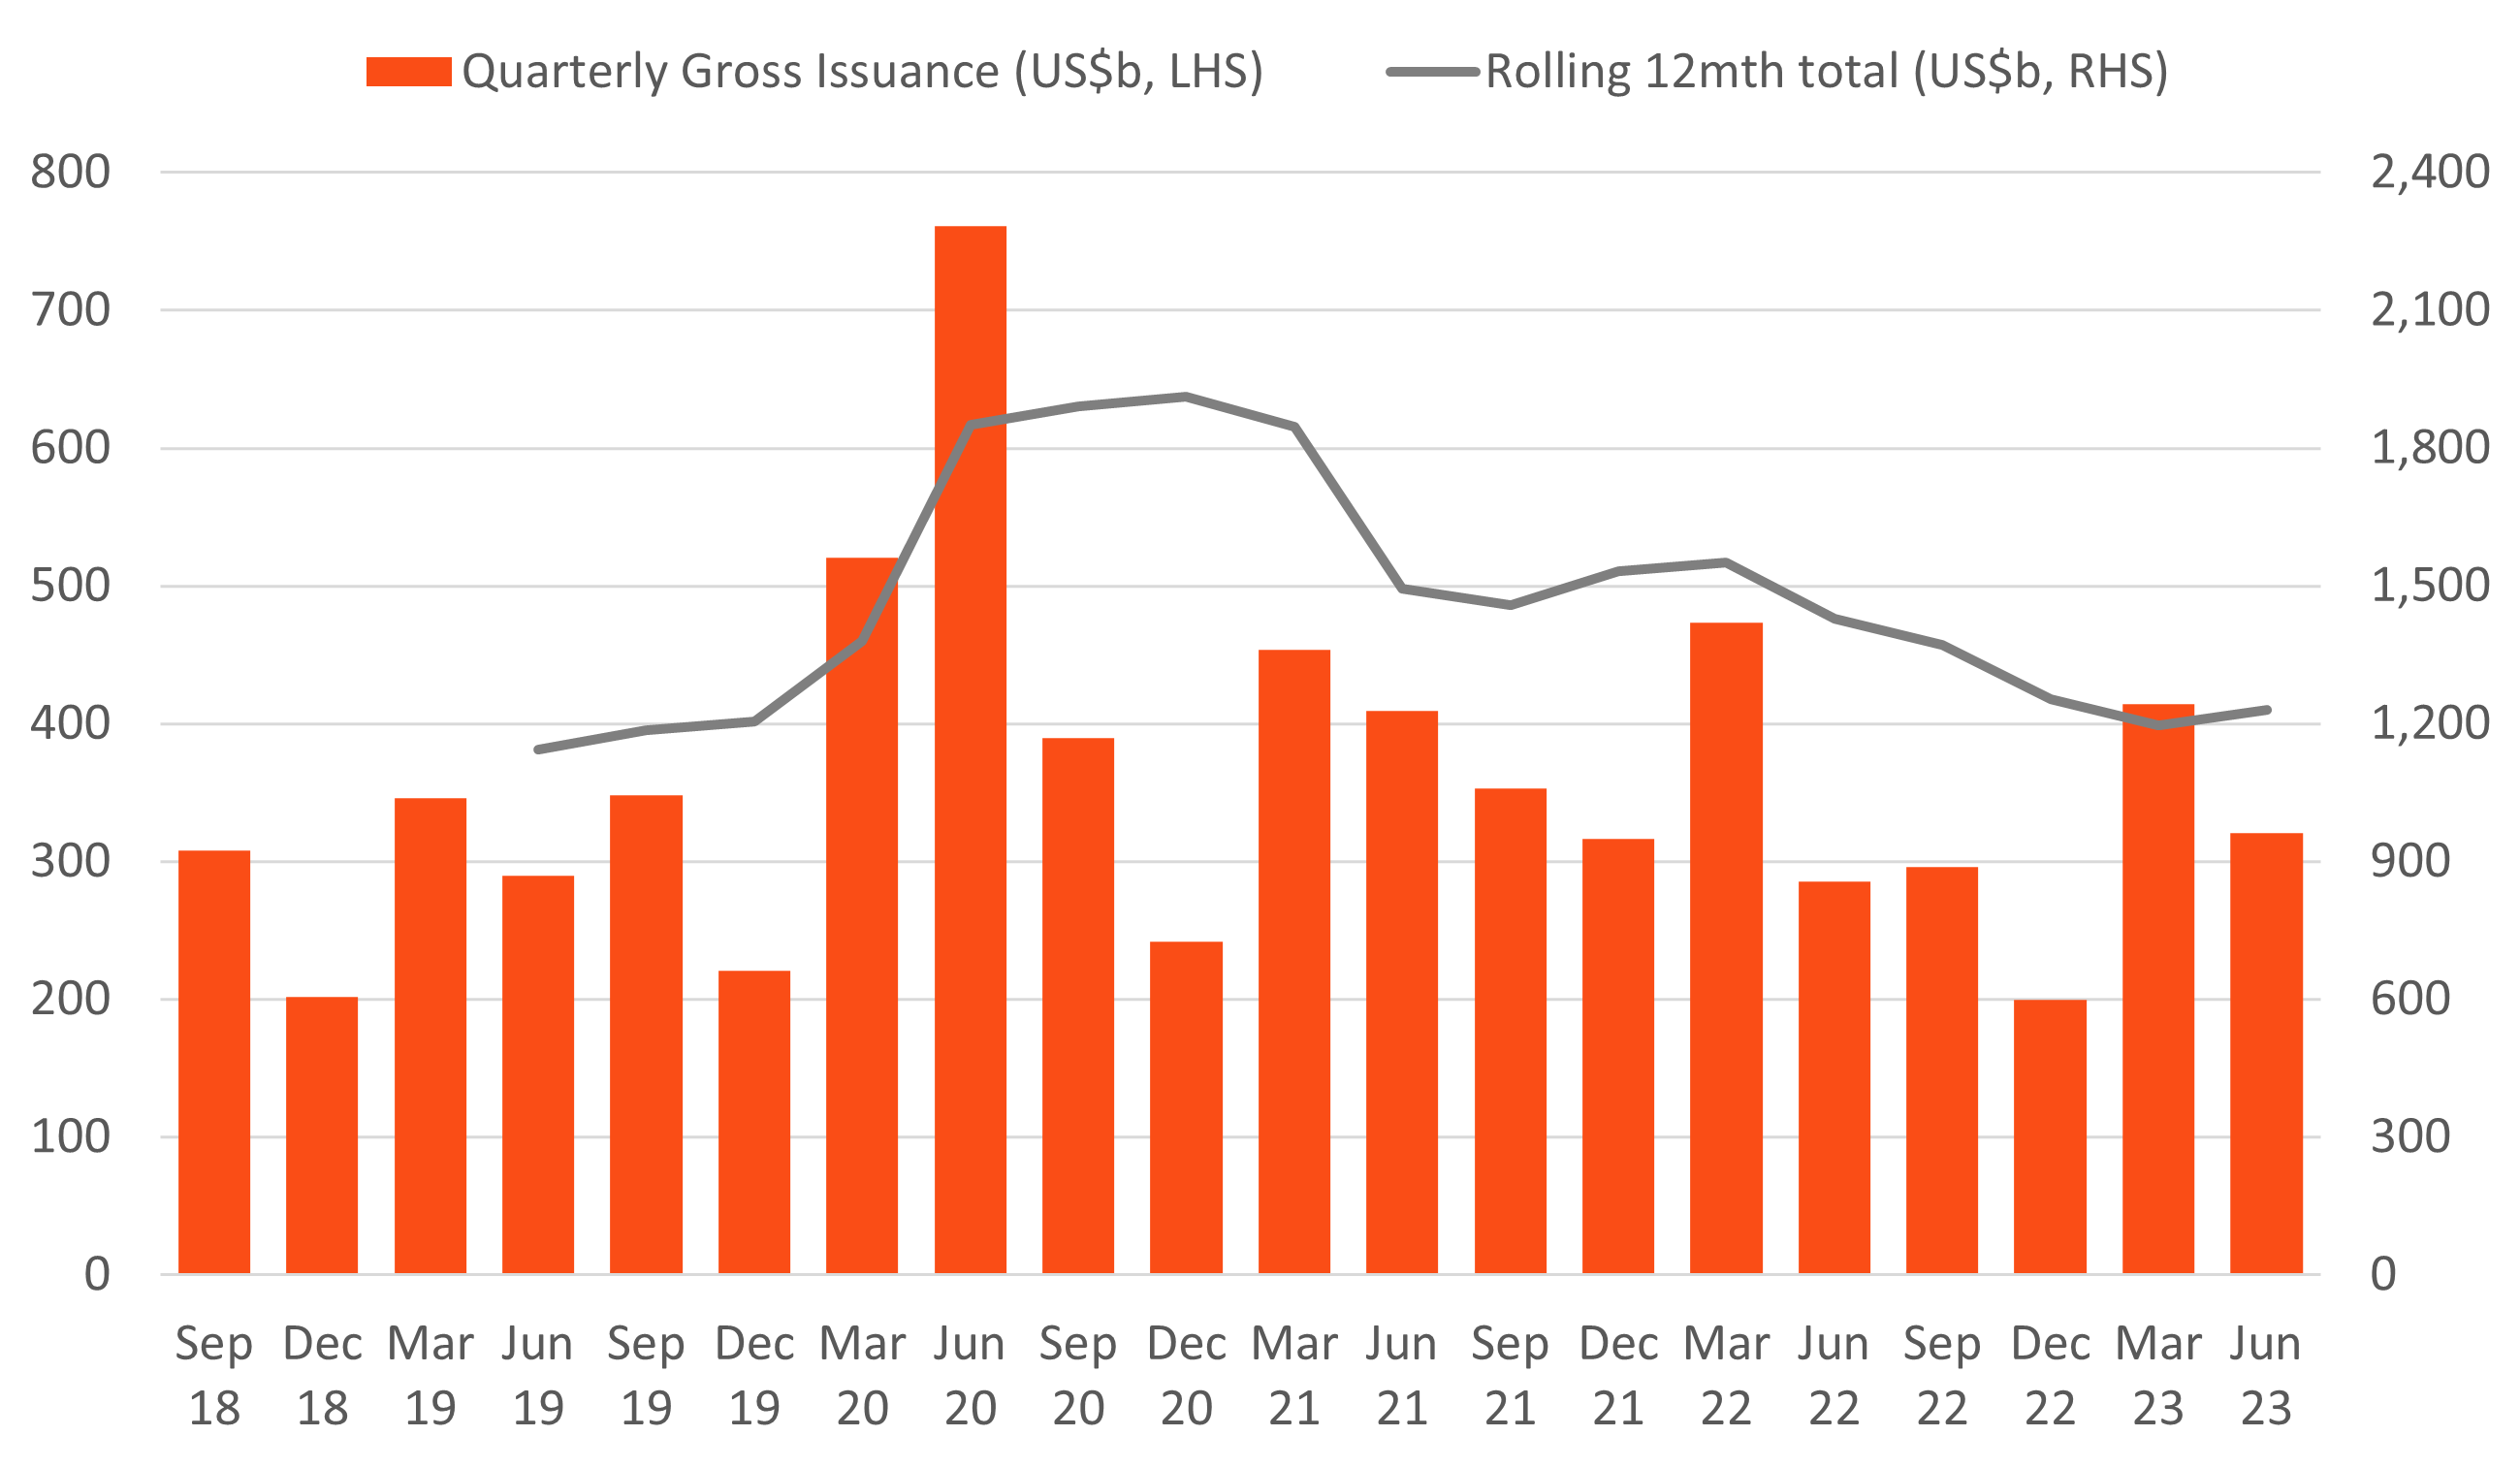
Chart 7: AUD gross corporate bond issuance (A$b); Sources: Bloomberg
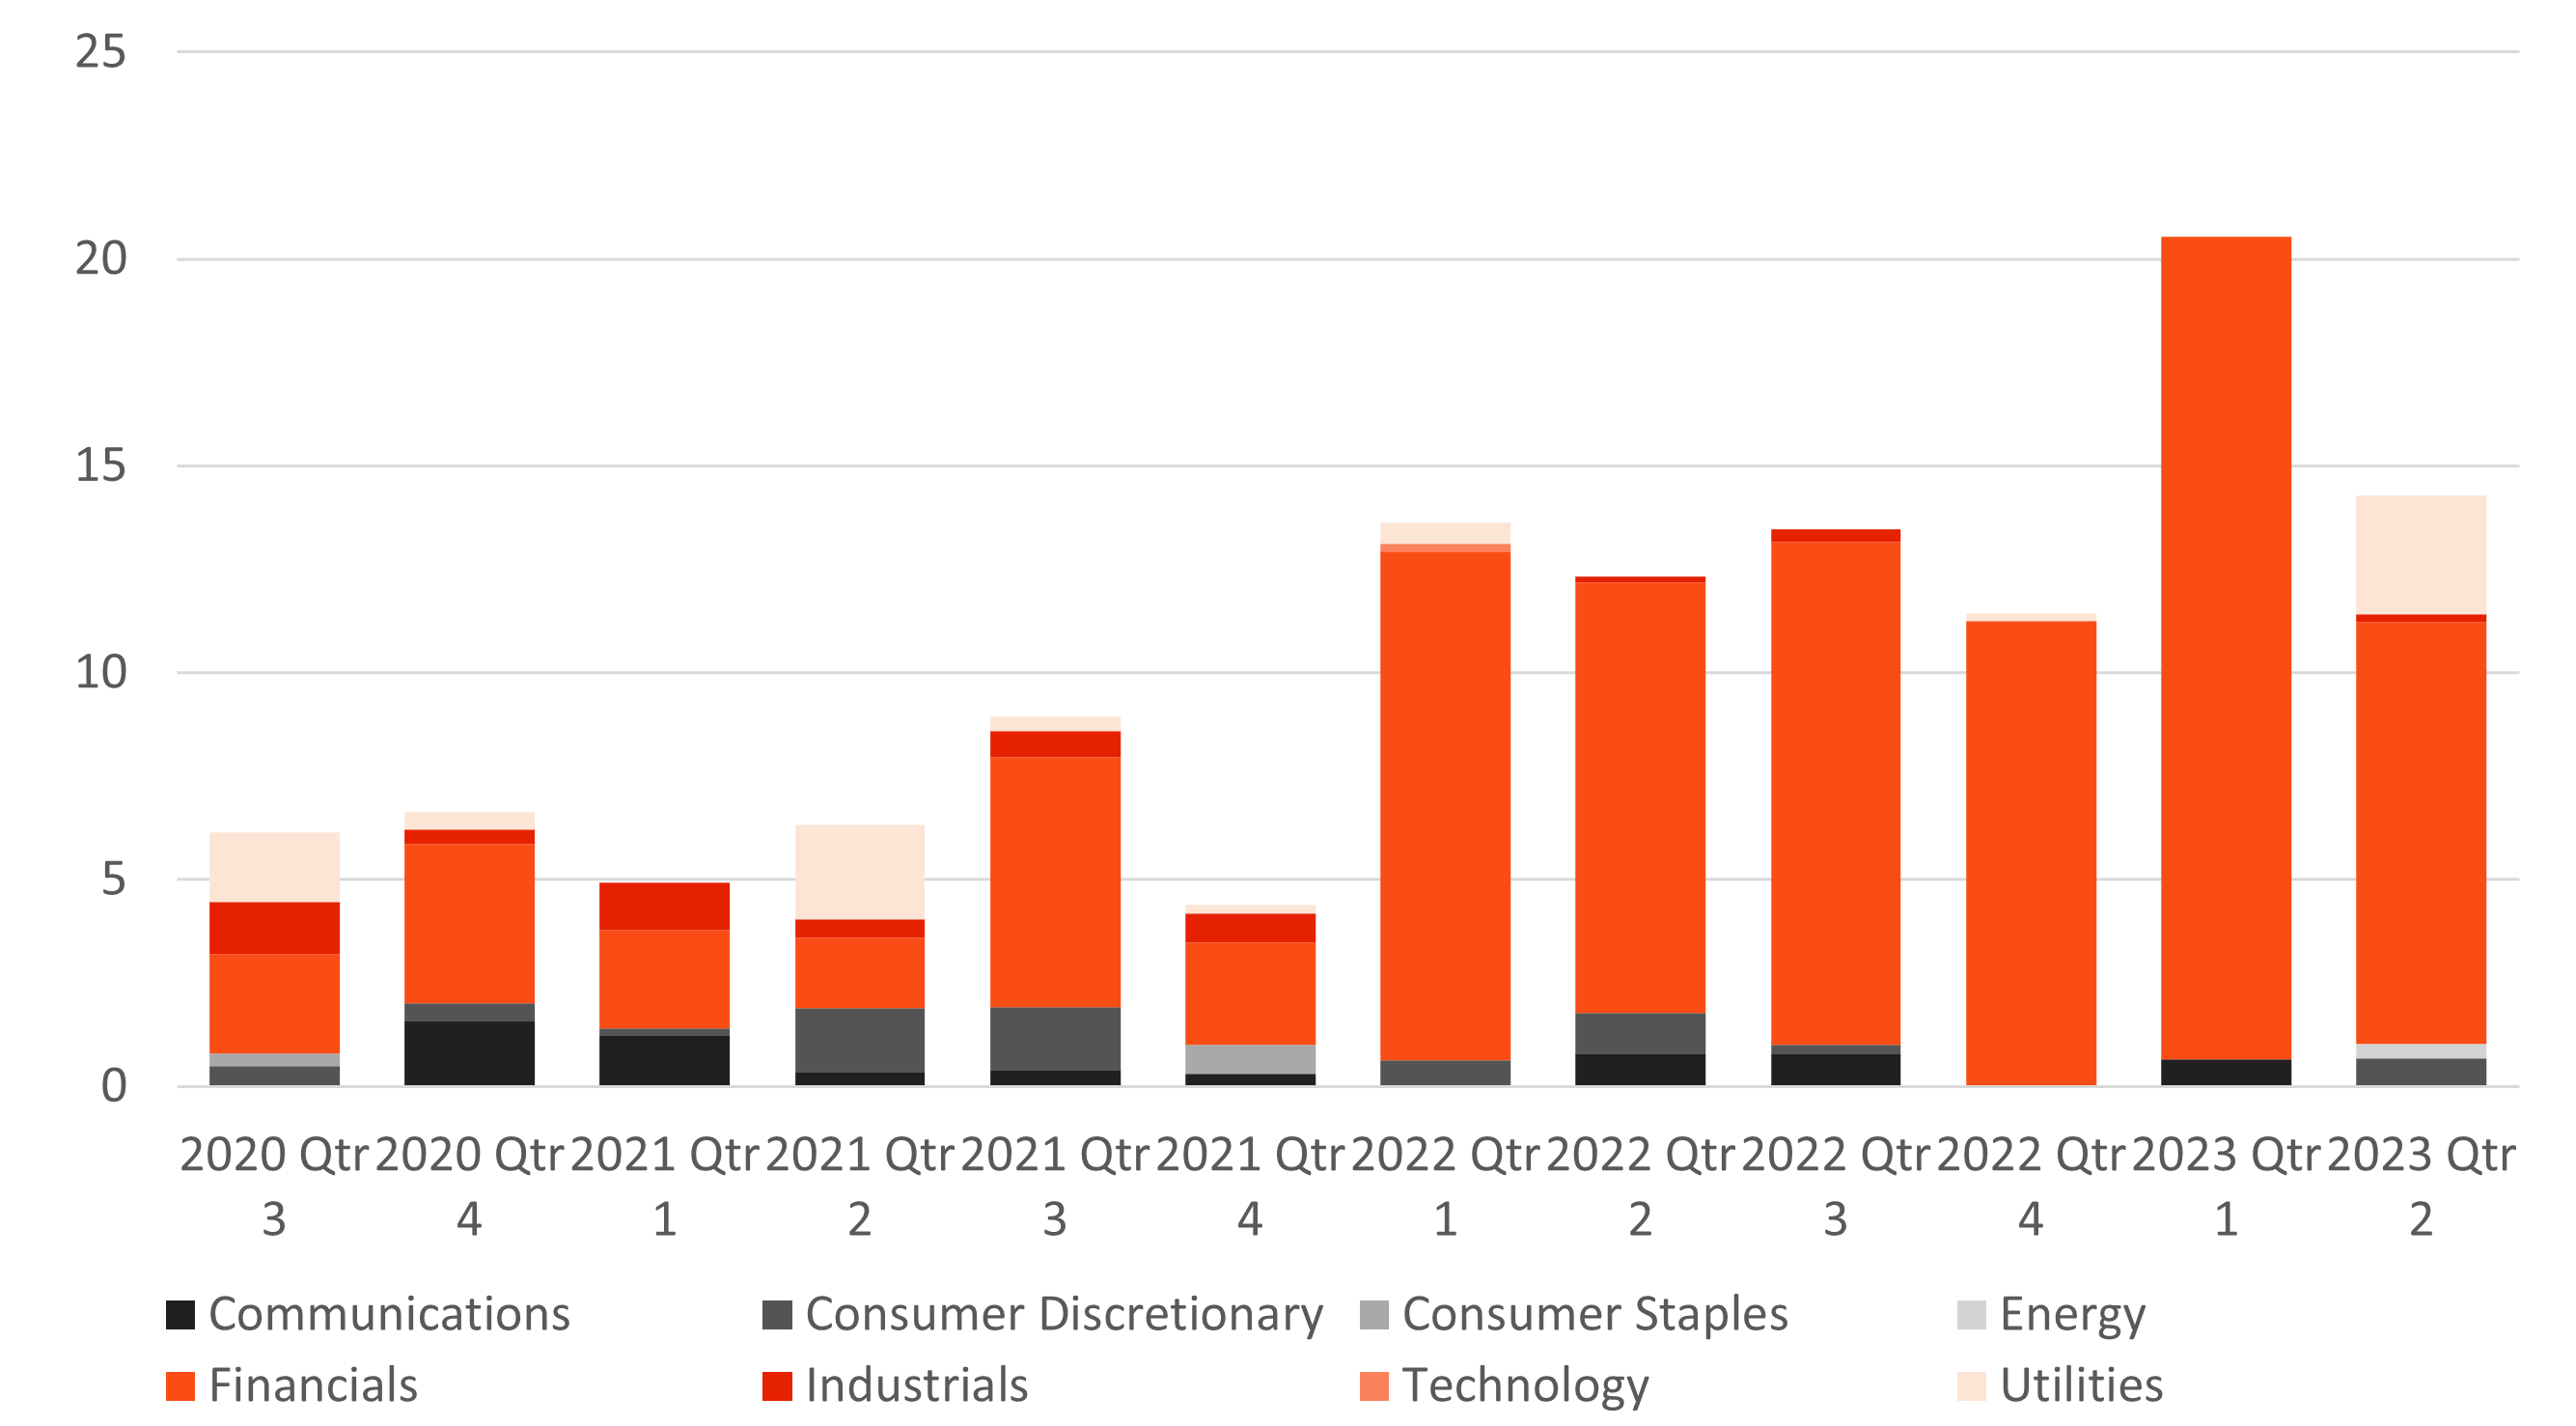
Chart 8: US financial conditions; Source: Goldman Sachs
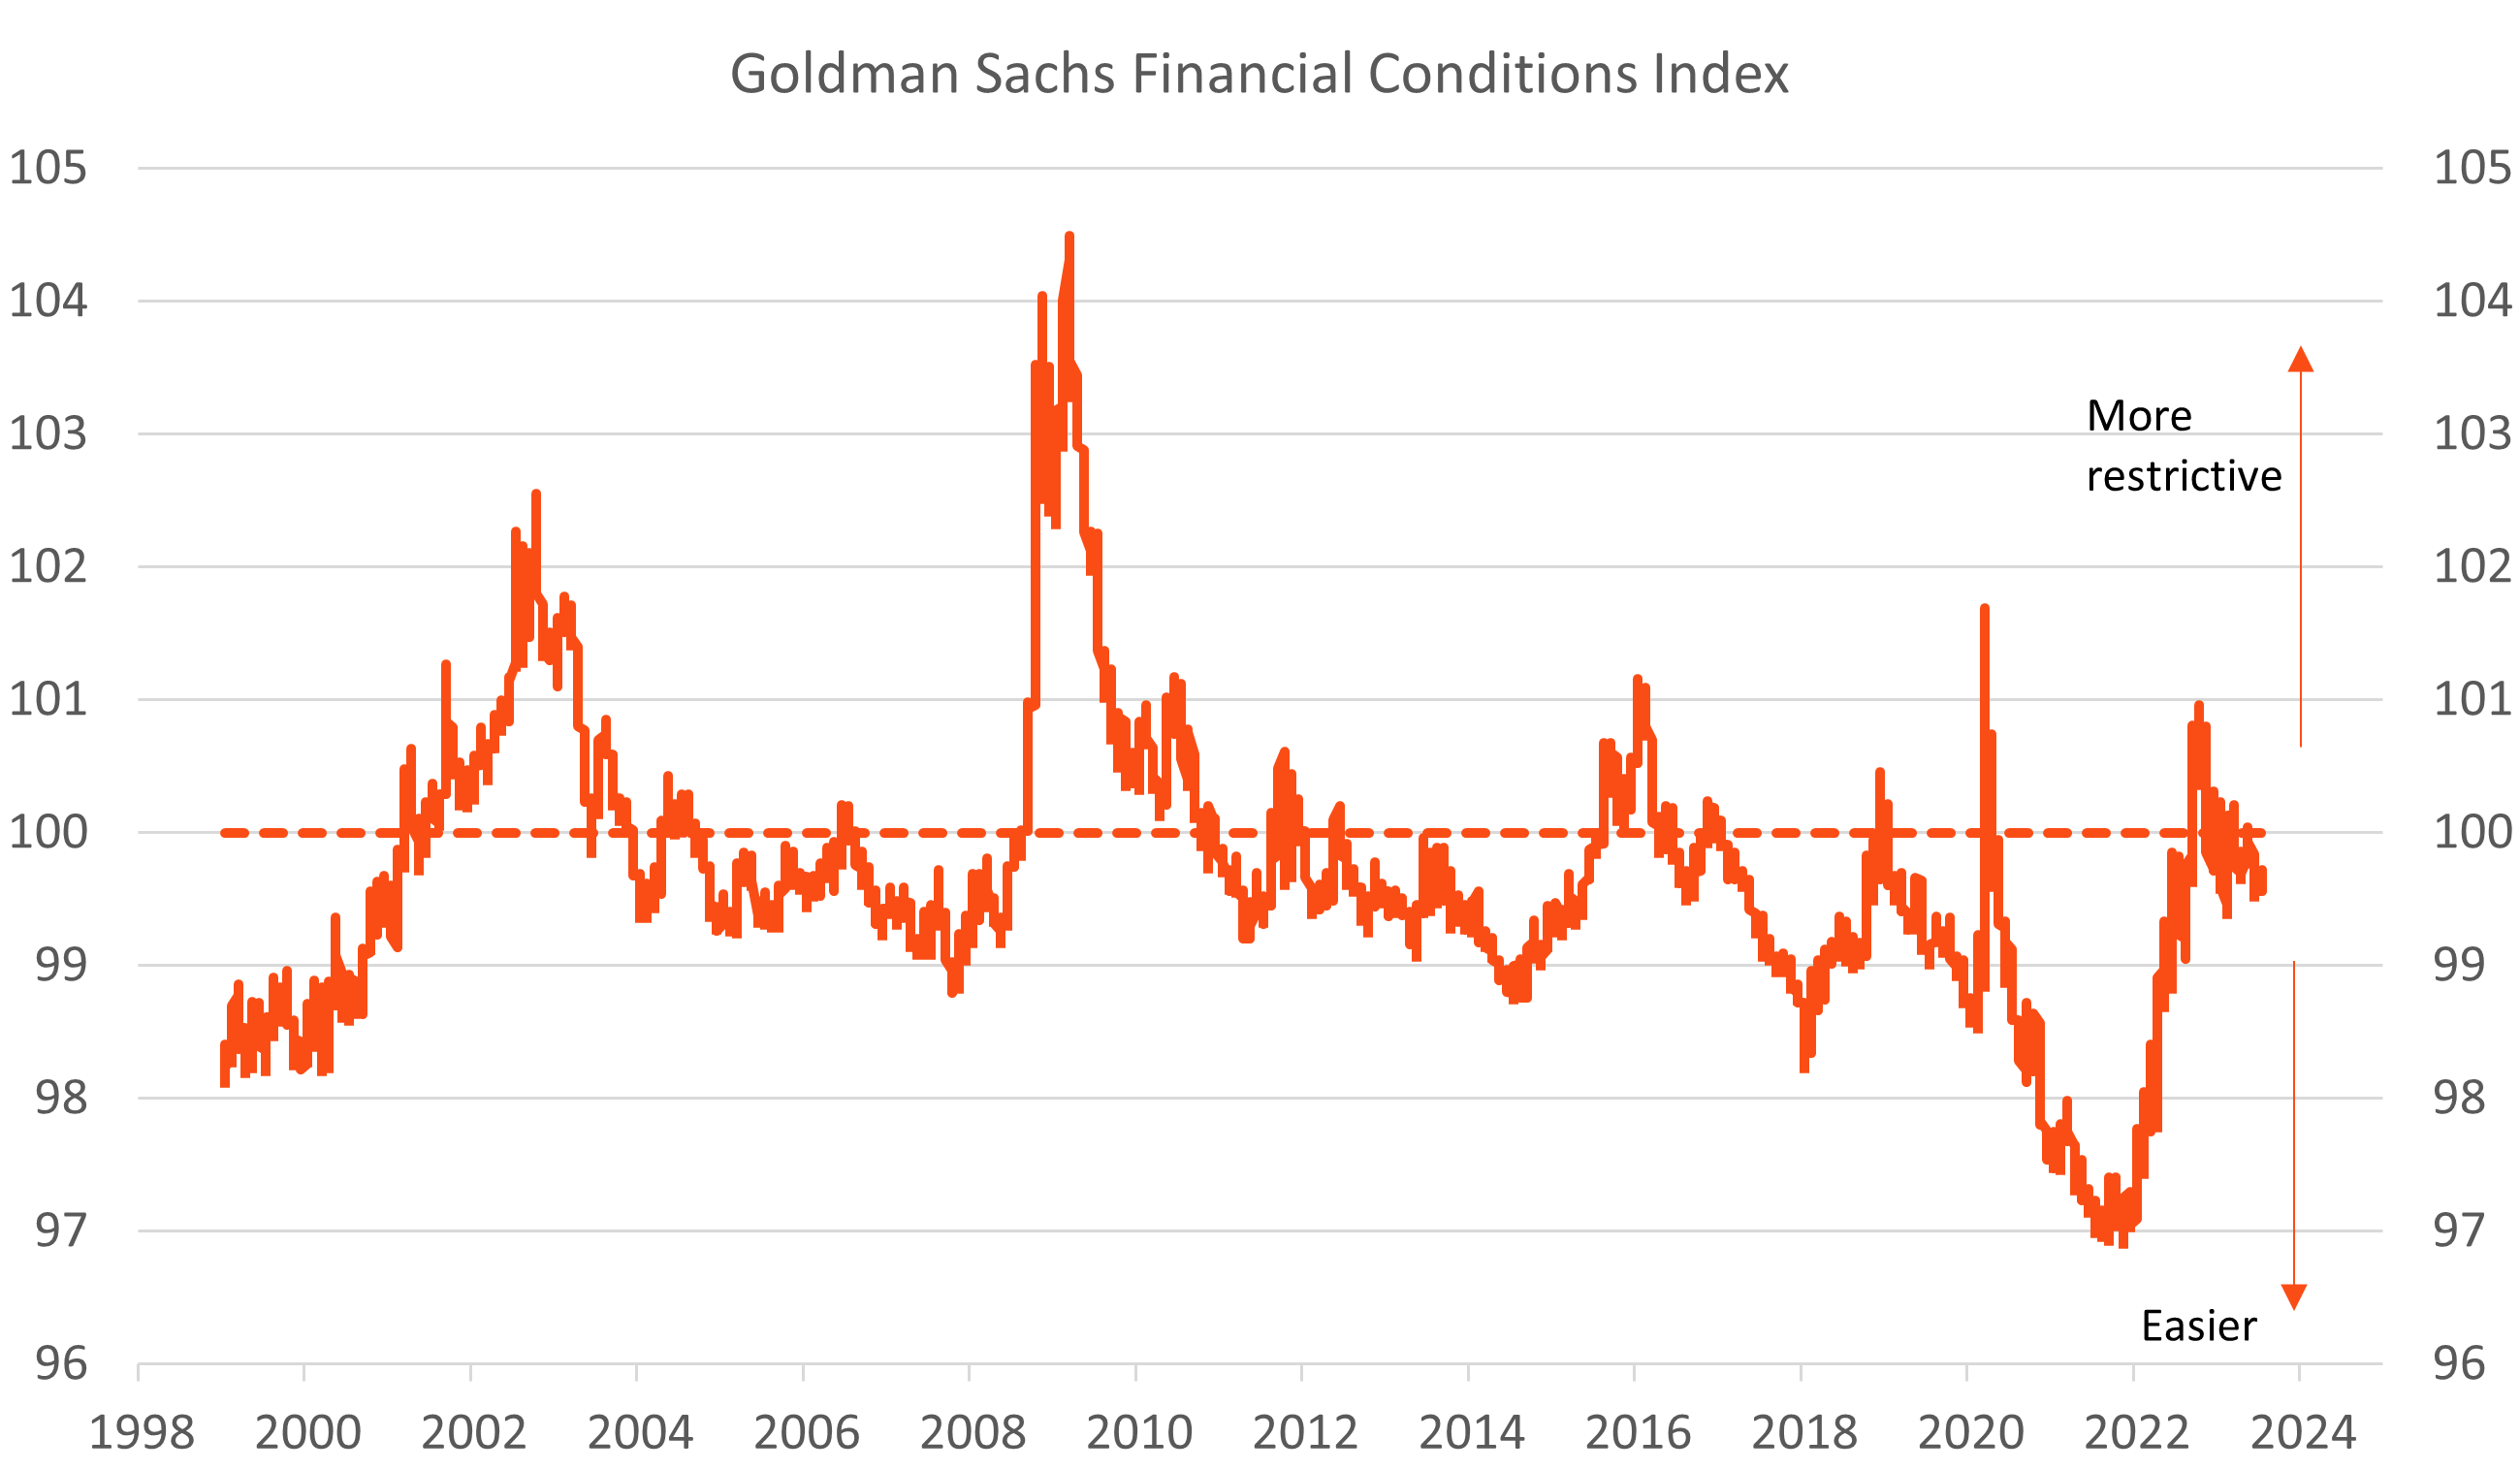
Chart 9: Quarterly change in central bank balance sheets; Sources: Bloomberg
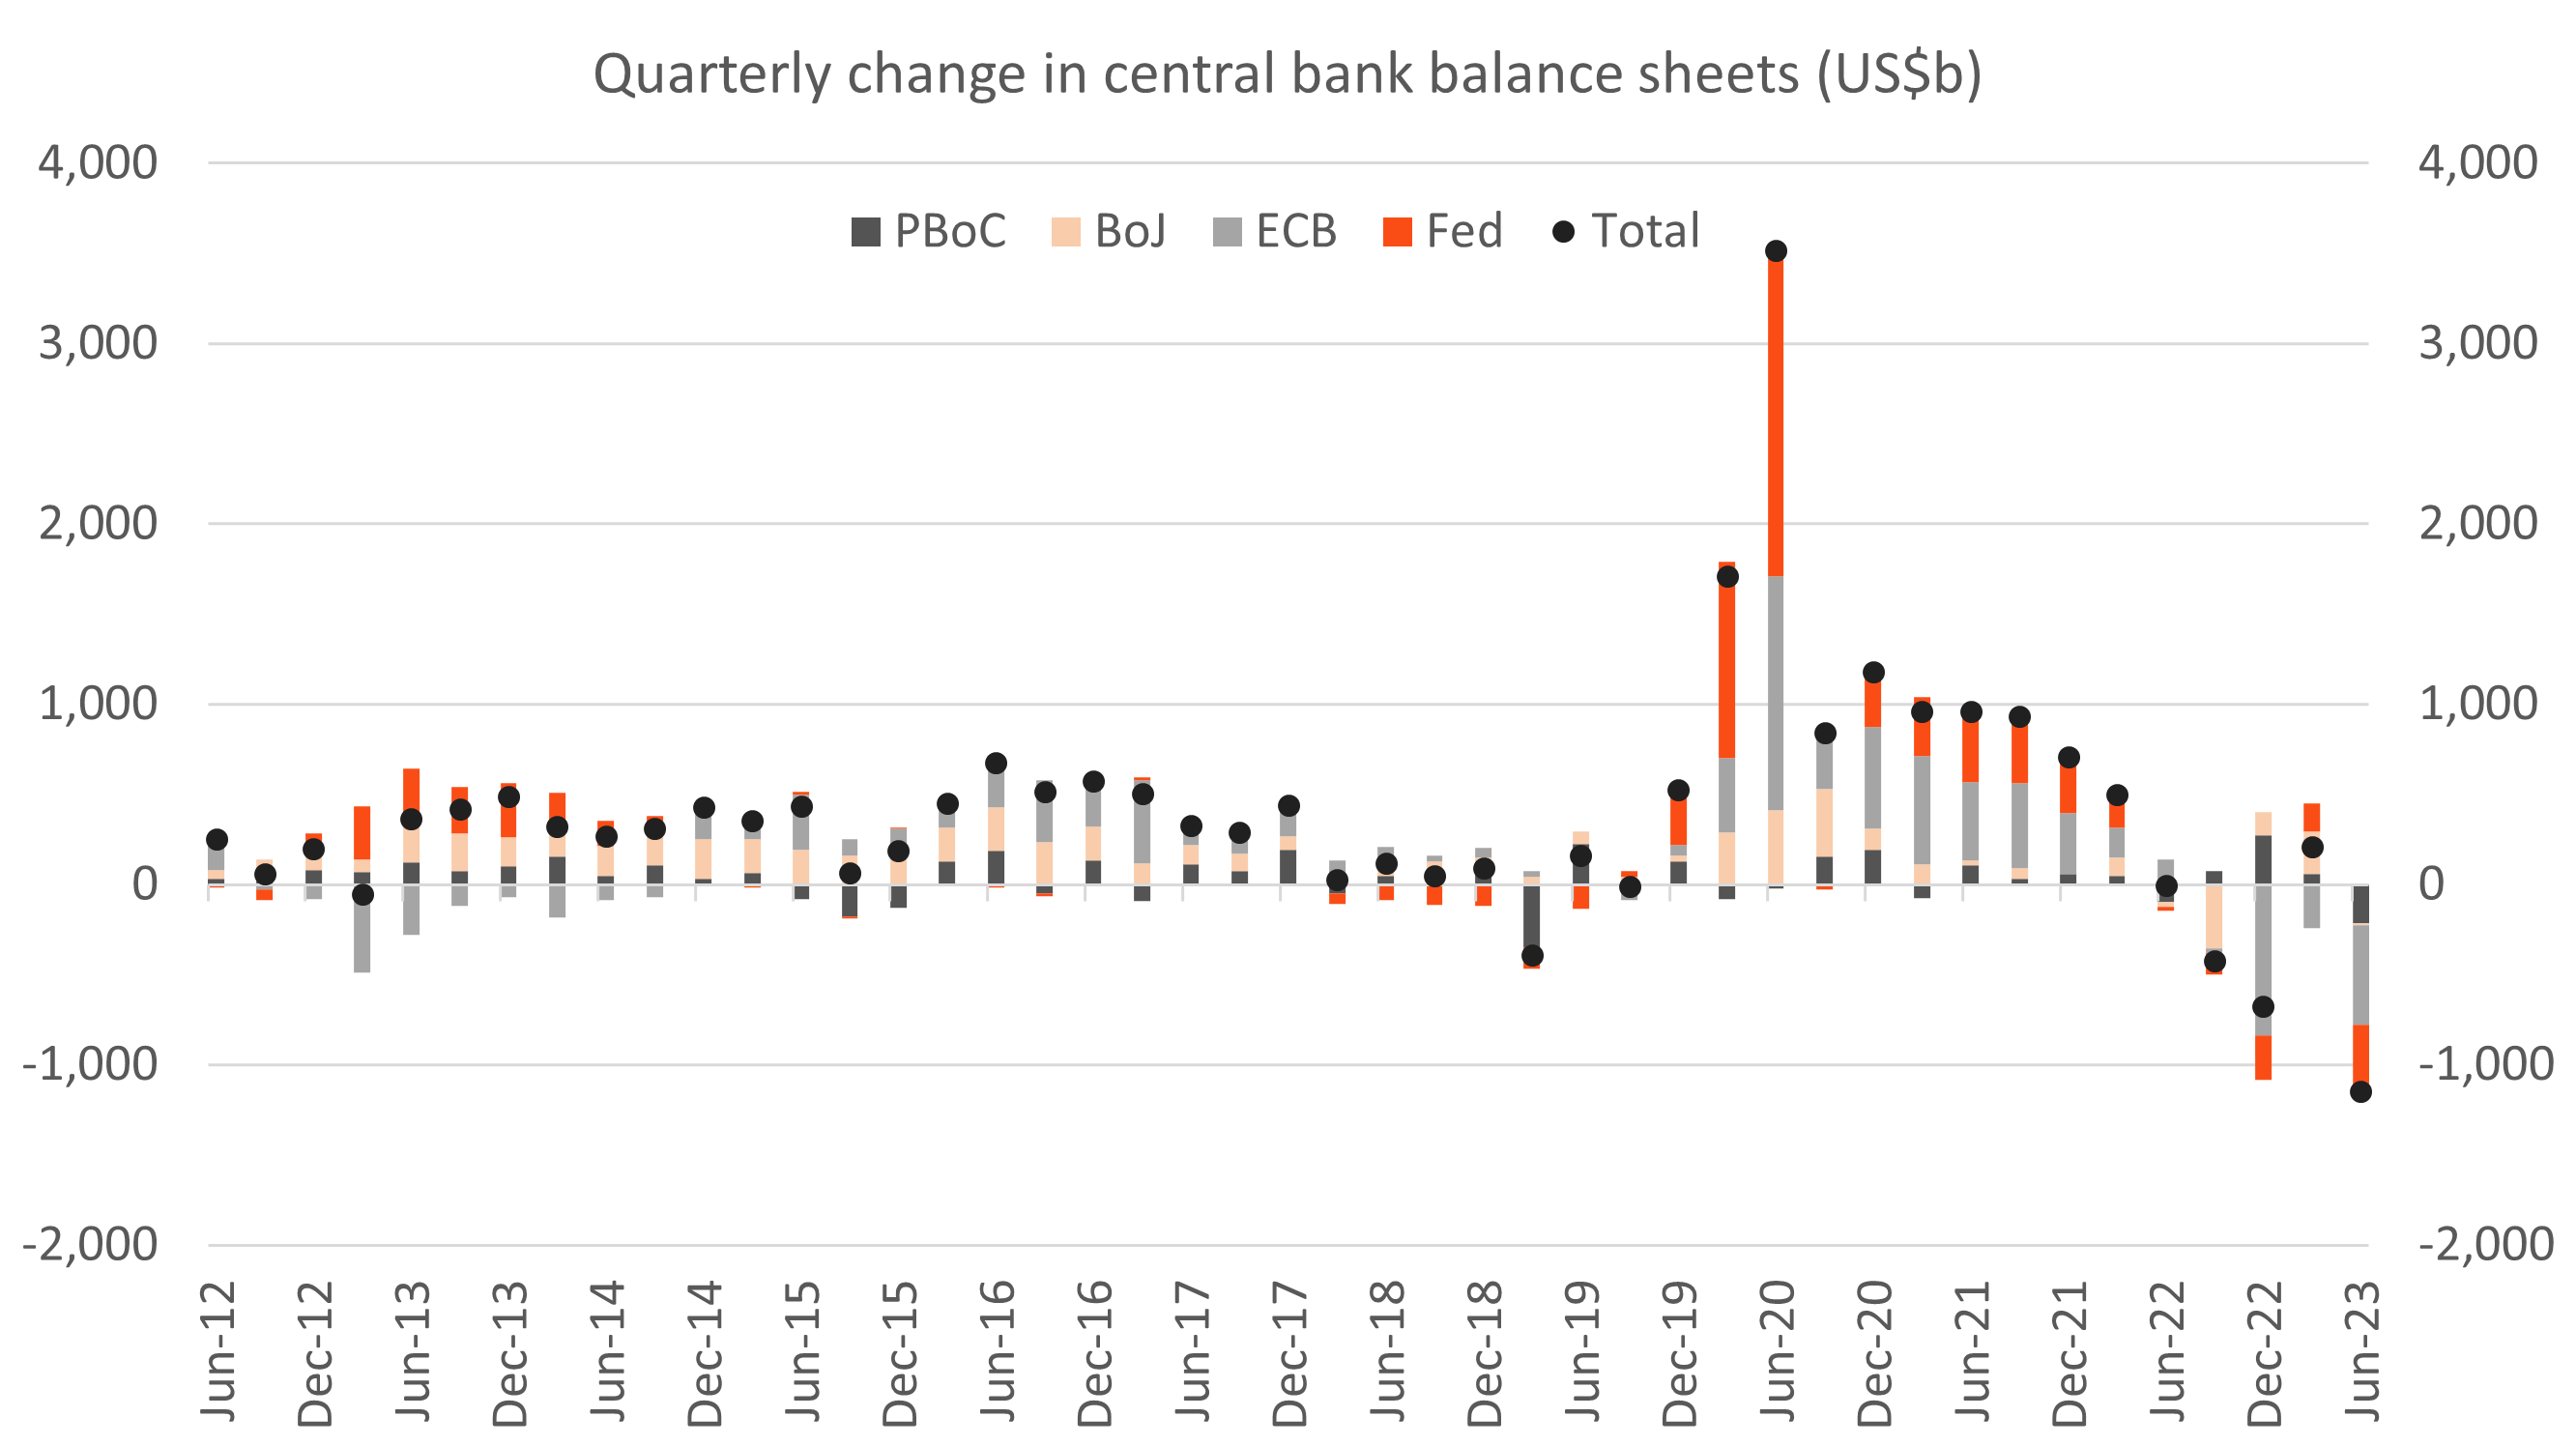
Chart 10: US inflation; Sources: BLS, Bloomberg
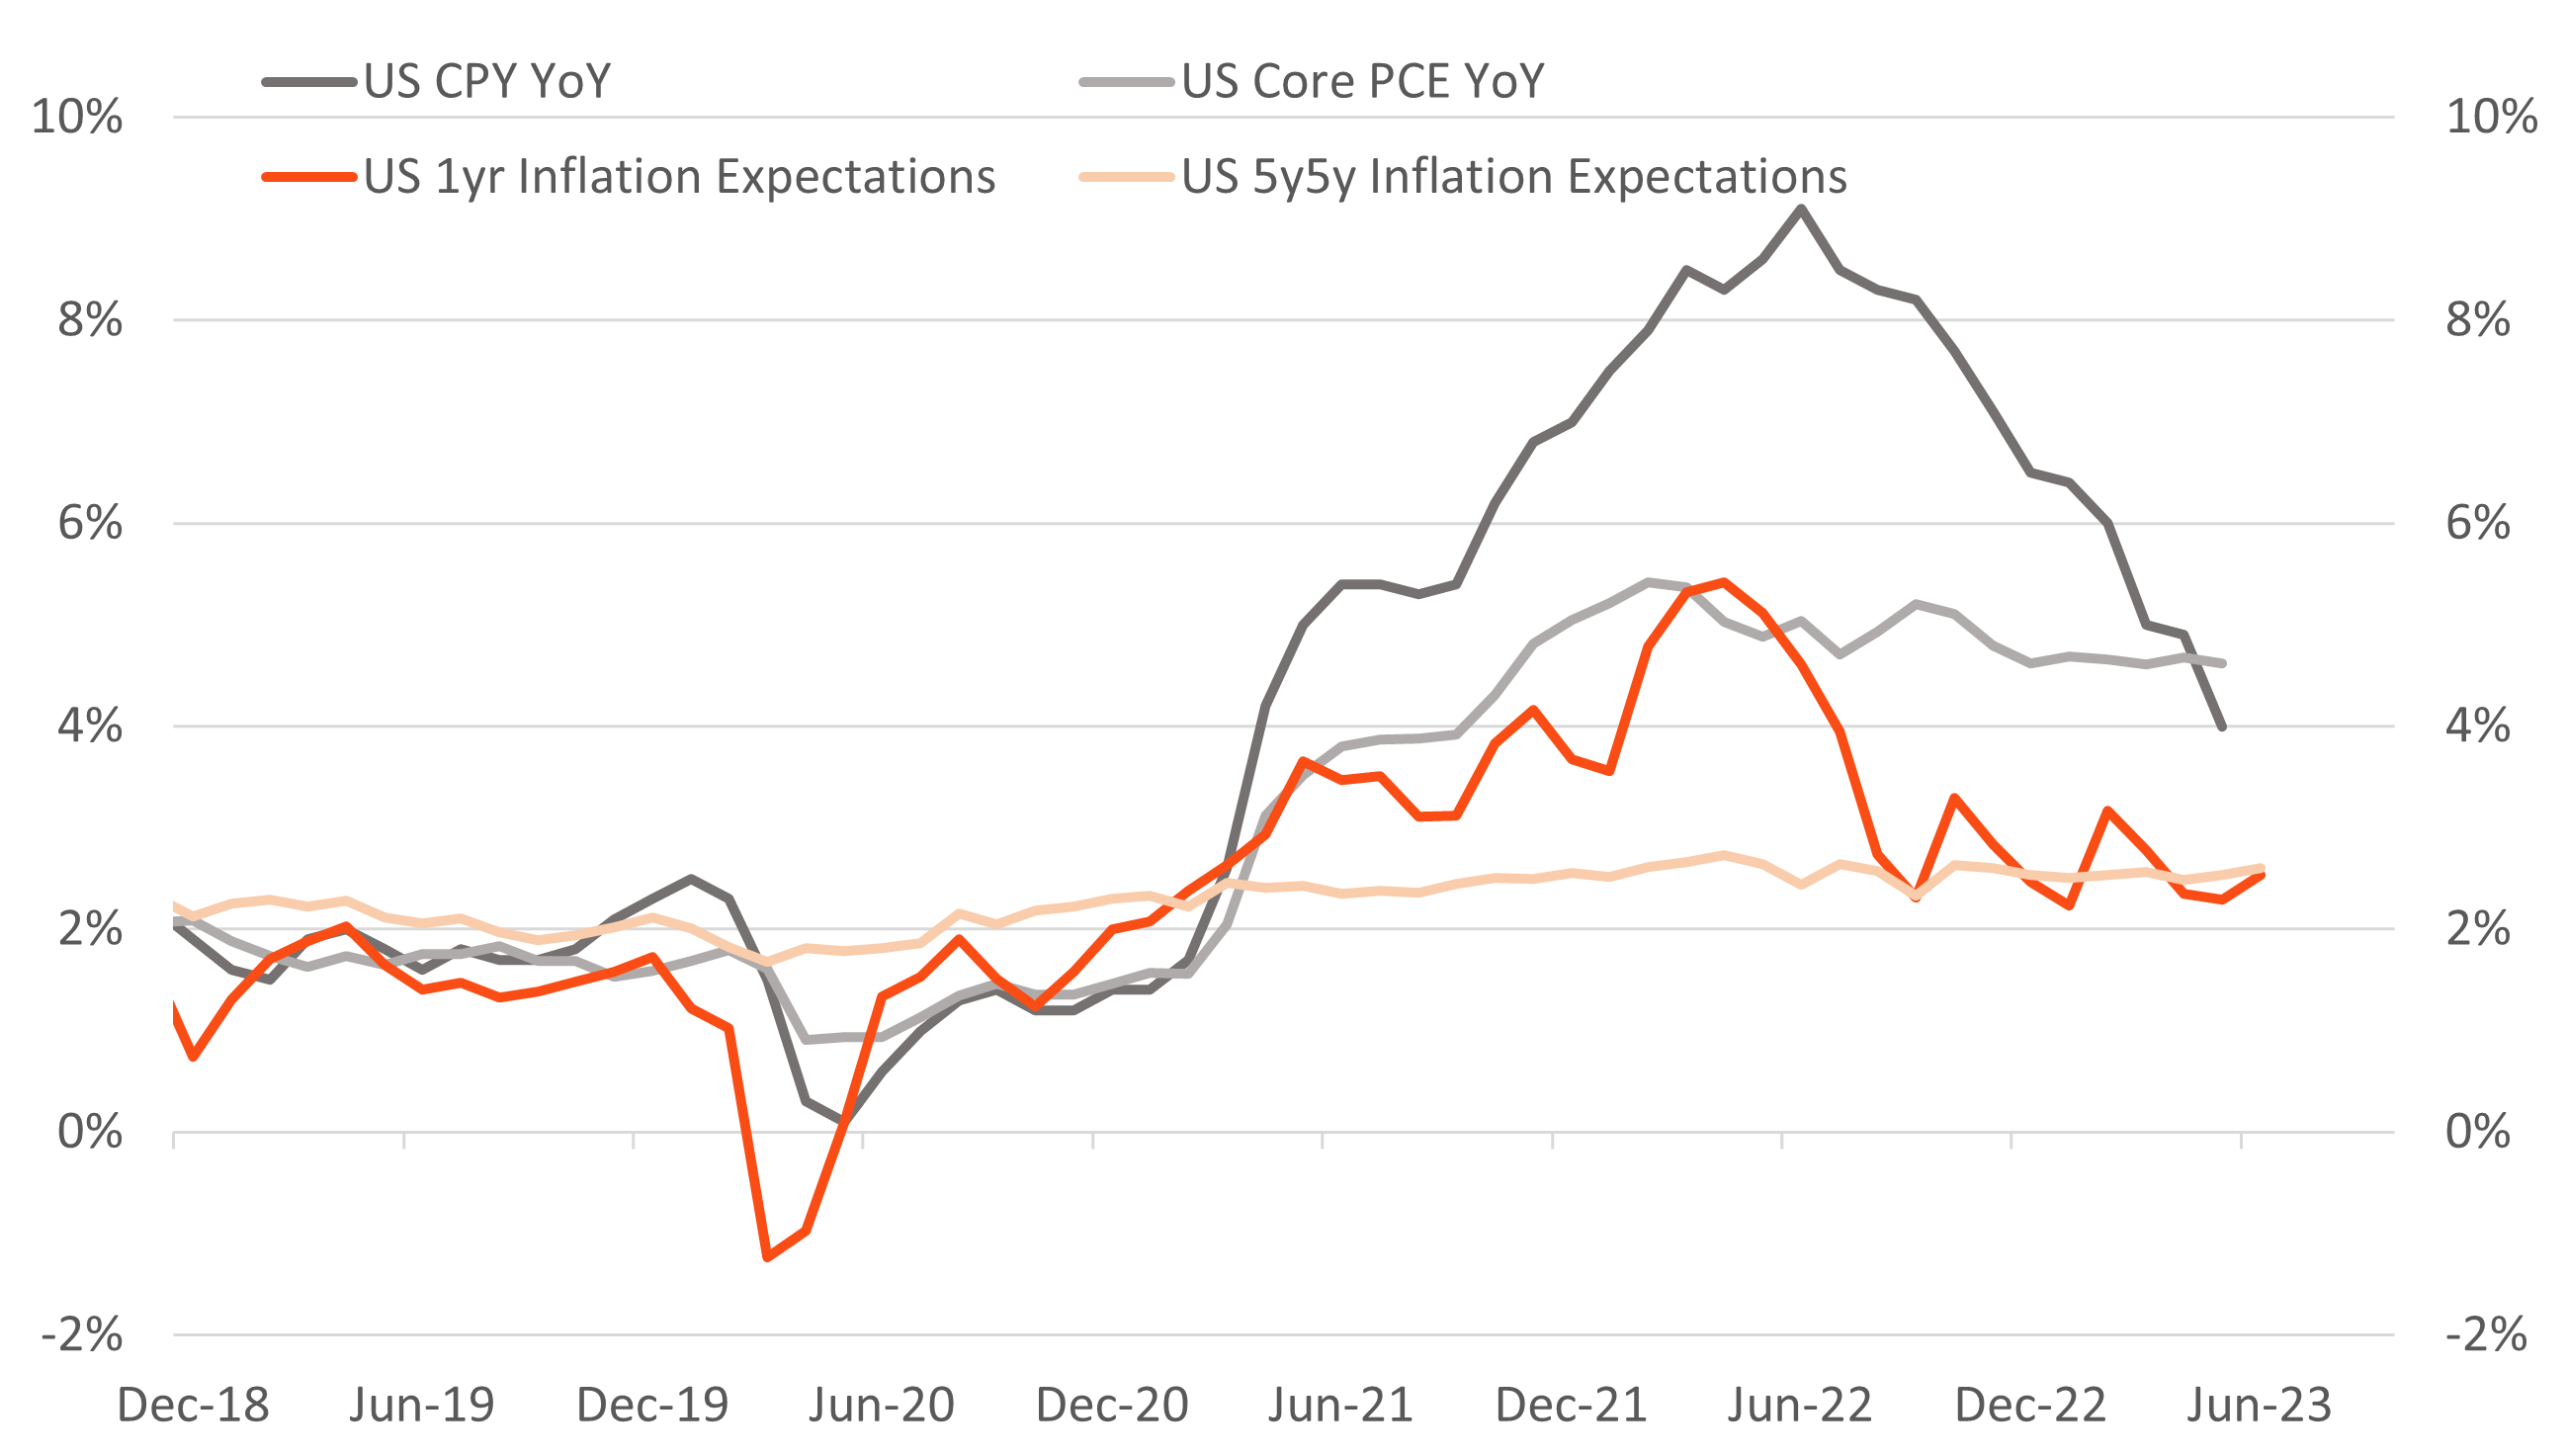
Chart 11: Australian inflation; Sources: ABS, Bloomberg
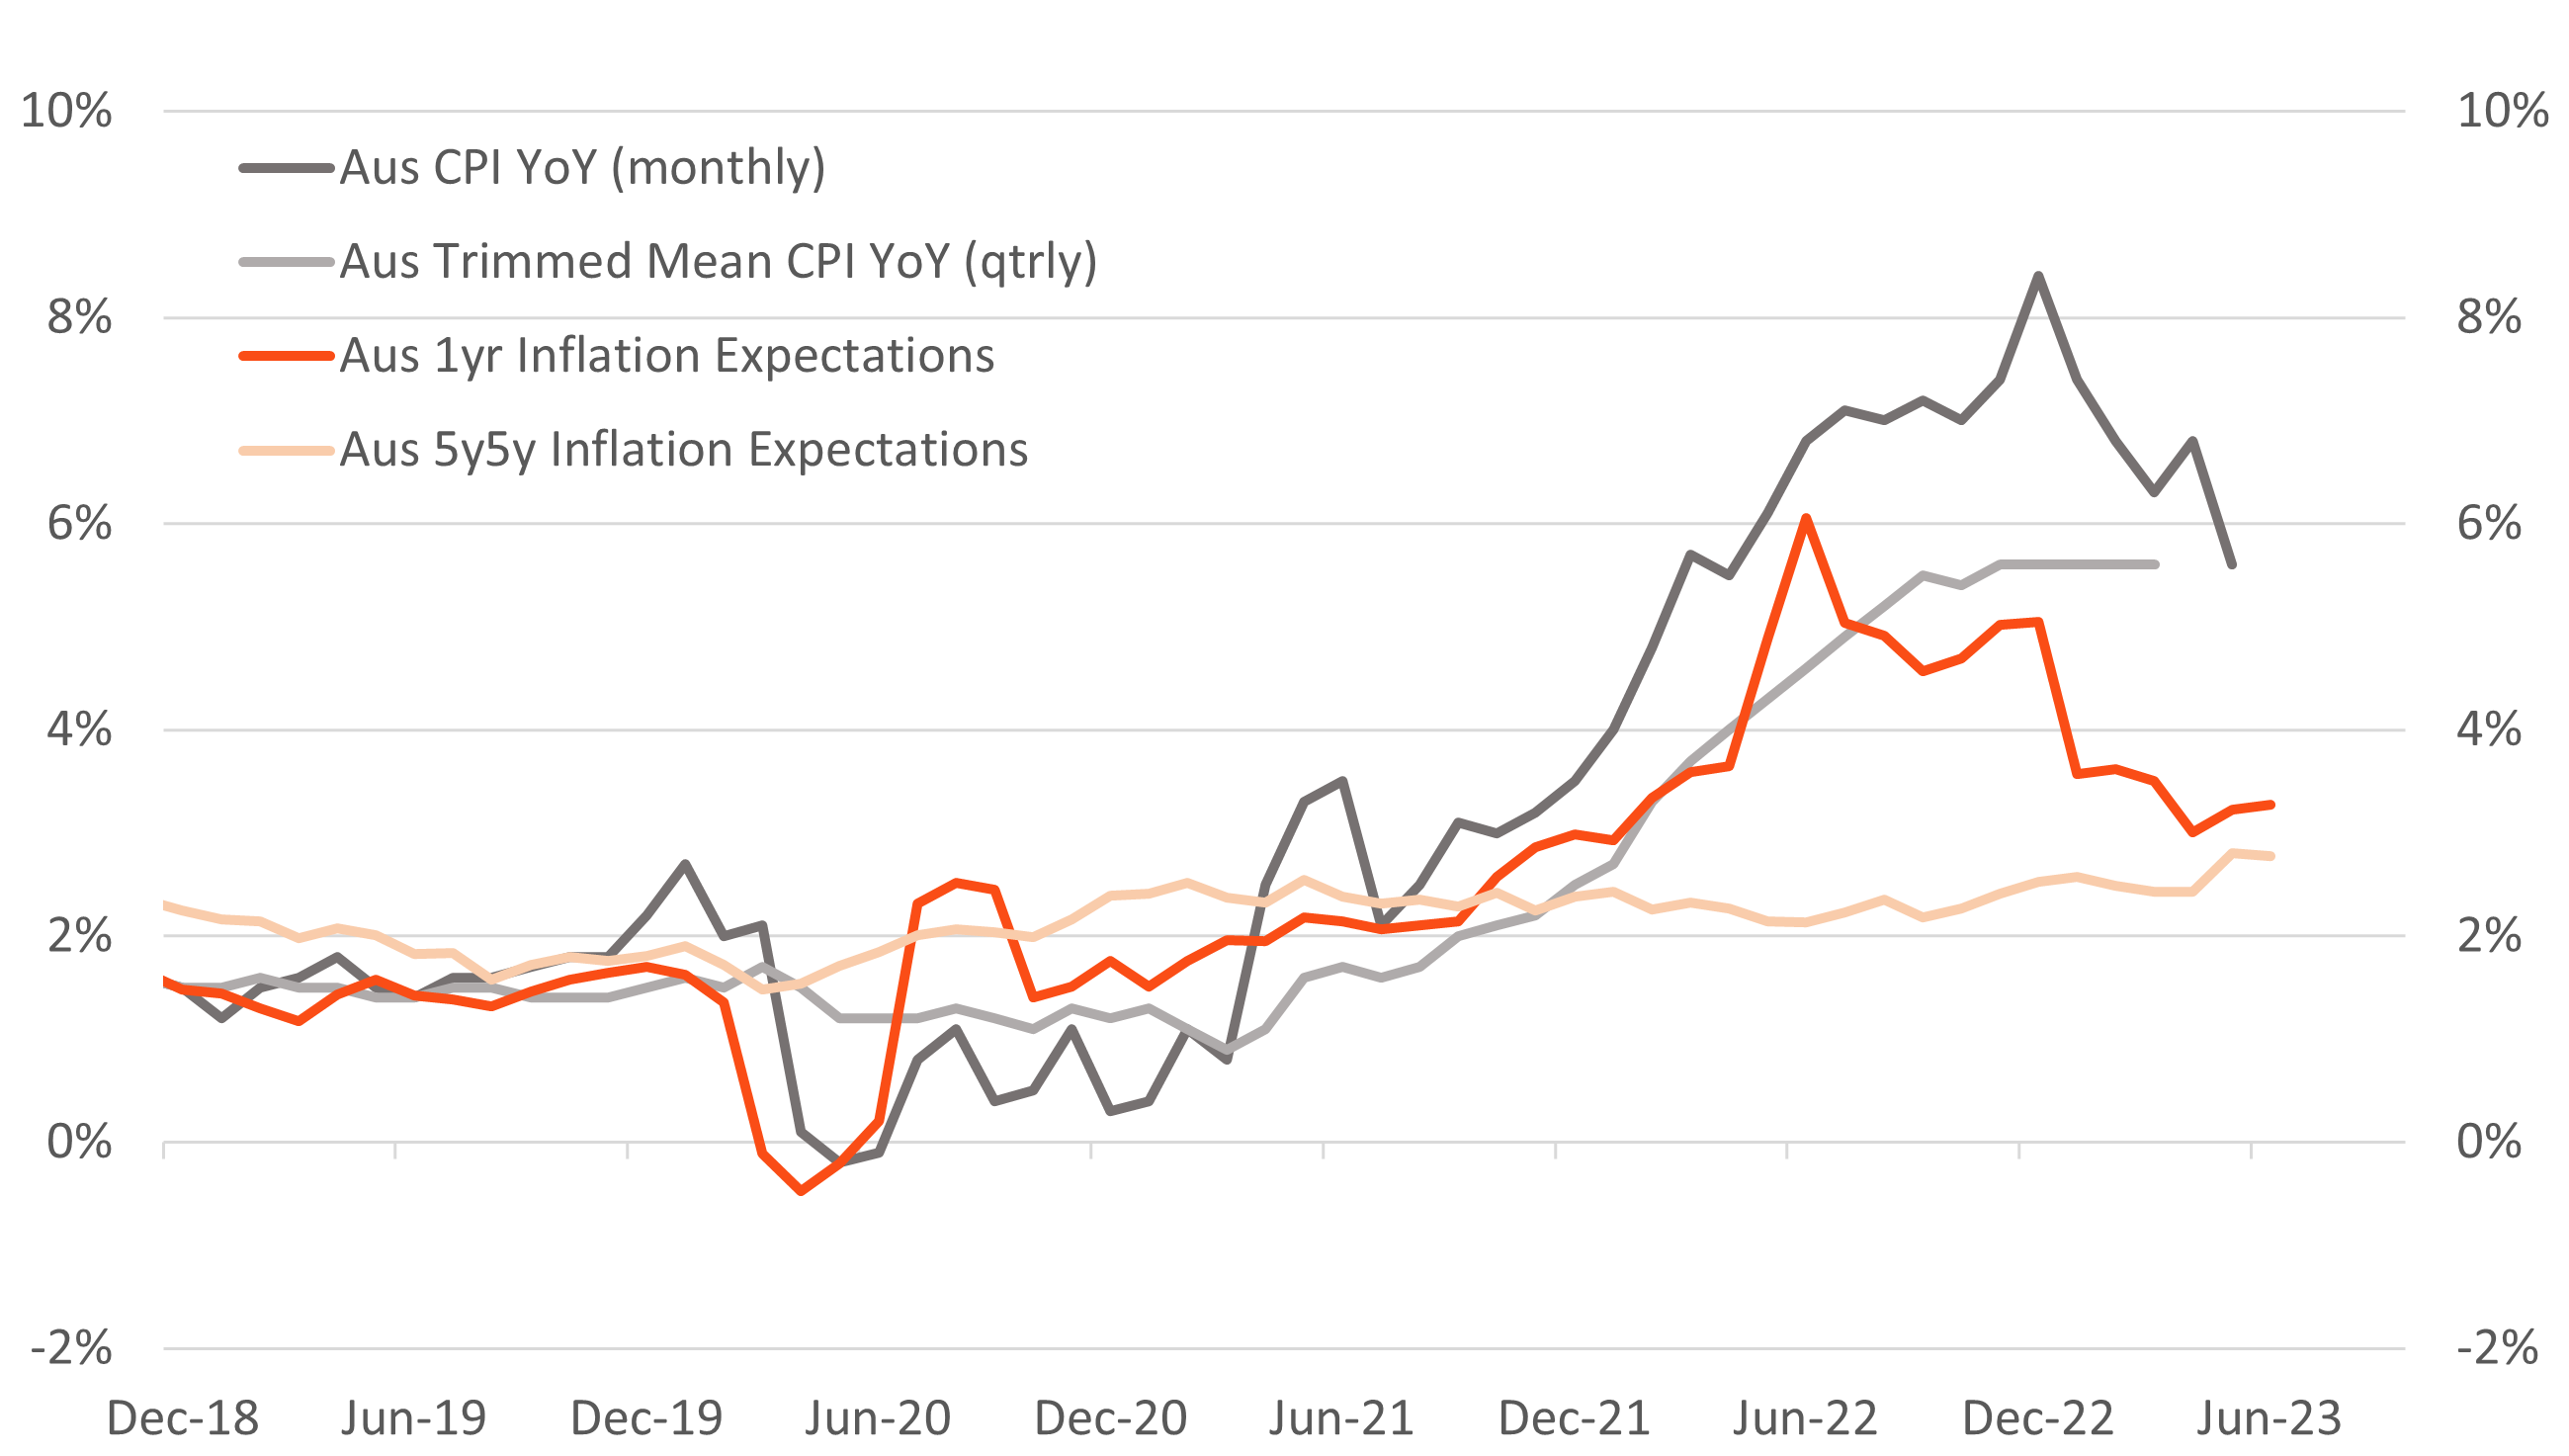
Chart 12: Real yields; Source: Bloomberg
The information contained in this document is general information only and does not constitute personal financial advice. It does not take into account any person’s financial objectives, situation or needs. It has been prepared by Betashares Capital Limited (ABN 78 139 566 868, Australian Financial Services Licence No. 341181) (“Betashares”).
The information is provided for information purposes only and is not a recommendation to make any investment or adopt any investment strategy. Betashares assumes no responsibility for any reliance on the information in this document. Past performance is not indicative of future performance. Investments in Betashares Funds are subject to investment risk and the value of units may go down as well as up.
Future results are inherently uncertain. This information may include opinions, views, estimates, projections, assumptions and other forward-looking statements which are, by their very nature, subject to various risks and uncertainties. Actual events or results may differ materially, positively or negatively, from those reflected or contemplated in such forward-looking statements. Forward-looking statements are based on certain assumptions which may not be correct. You should therefore not place undue reliance on such statements.
Any person wishing to invest in Betashares Funds should obtain a copy of the relevant PDS from www.betashares.com.au and obtain financial advice in light of their individual circumstances. You may also wish to consider the relevant Target Market Determination (TMD) which sets out the class of consumers that comprise the target market for the Betashares Fund and is available at www.betashares.com.au/target-market-determinations.
