Betashares Australian ETF Review: March 2025
4 minutes reading time
Better investing starts here
Get Betashares Direct
Betashares Direct is the new investing platform designed to help you build wealth, your way.
Scan the code to download.
Learn more
Learn more
Strong monthly inflows puts record year in sight
- Another strong month of net flows, combined with positive market movements pushed the Australian ETF Industry to a new all-time high in assets under management.
- With year to date industry netflows to September sitting at $20.5B, it appears likely that the previous annual record of $23.2B, set in 2021, will likely be eclipsed in The Australian experience mirrors the overseas trend, with 2024 looking likely to be a record year for the global ETF industry more broadly.
- September saw the ETF industry continue its strong momentum, with high net flows pushing the industry to a new all-time high. The industry rose by 3% for the month, with total market cap increasing by $6.7B. Total industry assets now stand at $226.9B – a new all-time record high.
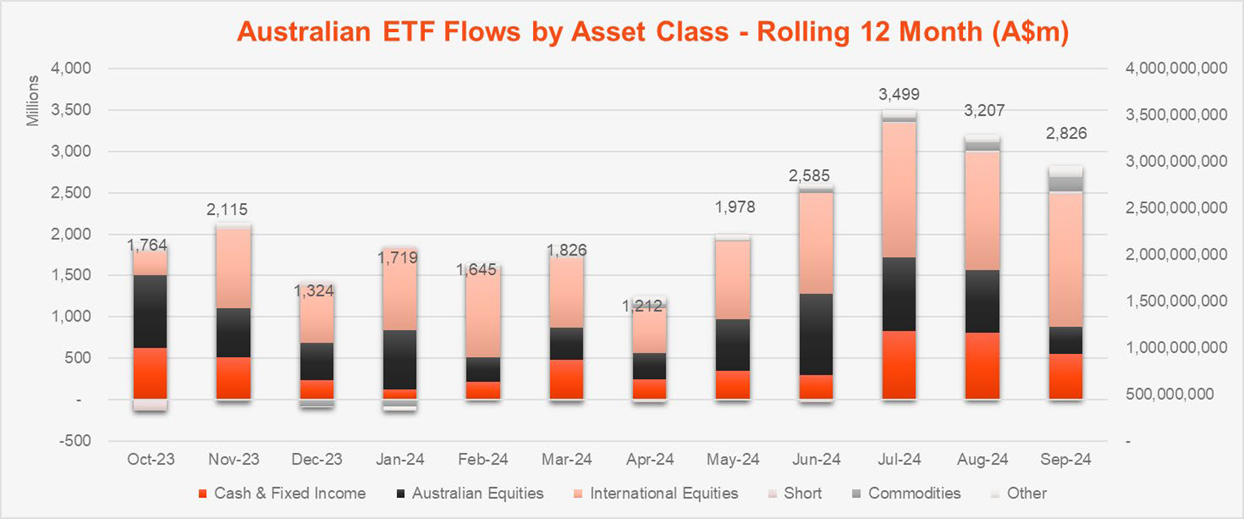
- Industry flows were strong with $2.8B recorded for the month.
- ASX trading value fell month on month but remained robust at ~$11.5B for September.
- Over the last 12 months the Australian ETF industry has grown by 45.4%, or $70.8B.
- In terms of product launches, there were 5 new funds launched in September. Separately, Global X closed their carbon credits ETF and P. Morgan closed an active ETF over sustainable infrastructure equities.
- The best performing ETFs this month were Chinese equity exposures.
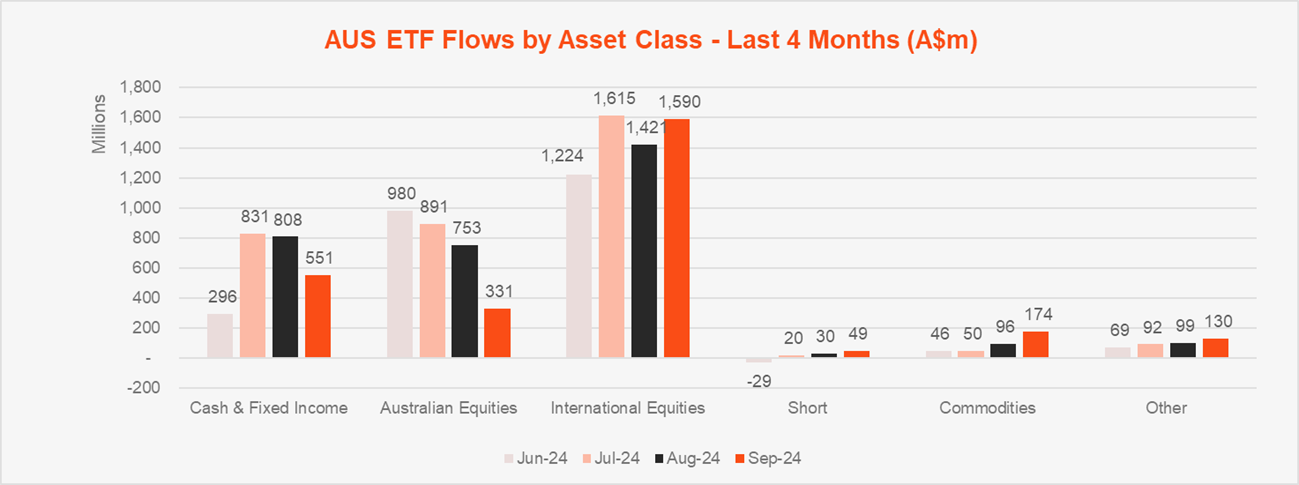
- September was another stand out month for International Equities products ($1.6B), as they received more than triple the amount of net flows of the second placed Fixed Income products ($496 million). Australian Equities was in third spot with $331 million.
- No categories received outflows this month.
Australian ETF Industry AuM: July 2001 – September 2024
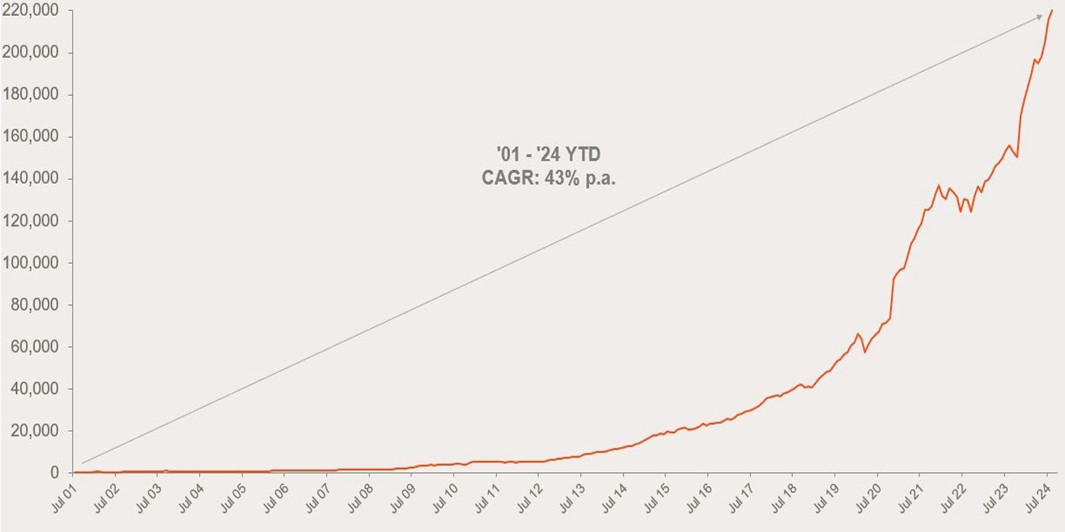
CAGR: Compound Annual Growth Rate. Source: ASX, CBOE
Market Cap
- Australian Exchange Traded Funds Market Cap (ASX + CBOE): $226.9B – all time high
- ASX CHESS Market Cap: $191.78B1
- Market Cap change for September: 3.1%, $6.7B
- Market cap growth for last 12 months: 45.4%, $70.8B
New Money
- Net inflows for month: $2.8B
Products
- 396 Exchange Traded Products trading on the ASX & CBOE
- In terms of product launches, there were 5 new funds launched in September. Separately, Global X closed their carbon credits ETF and J.P. Morgan closed an active ETF over sustainable infrastructure equities.
Trading Value
- ASX trading value was lower at ~$11.5B for the month.
Performance
- The best performing ETFs this month were Chinese equity exposures.
Industry Net Flows
Top Category Inflows (by $) – Month
| Broad Category | Inflow Value |
| International Equities | $1,589,841,951 |
| Fixed Income | $495,568,869 |
| Australian Equities | $331,383,215 |
| Commodities | $174,419,015 |
| Multi-Asset | $70,771,899 |
Top Category Outflows (by $) – Month
No category outflows
Top Sub-Category Inflows (by $) – Month
| Sub-Category | Inflow Value |
| International Equities – Developed World | $906,900,130 |
| International Equities – US | $380,990,451 |
| Australian Bonds | $332,495,135 |
| Australian Equities – Broad | $253,700,328 |
| Gold | $163,018,583 |
Top Sub-Category Outflows (by $) – Month
| Sub-Category | Inflow Value |
| Australian Equities – Large Cap | ($66,228,585) |
| International Equities – Geared | ($3,727,106) |
| Commodities – E&R – Sustainability | ($986,077) |
| International Equities – E&R – Impact | ($922,914) |
| Australian Equities – Small Cap | ($271,721) |
Performance
Top Performing Products – Month
| Ticker | Product Name | Performance (%) |
| CNEW | VanEck China New Economy ETF | 21.4% |
| IZZ | iShares FTSE China Large-Cap ETF | 20.1% |
| CETF | VanEck ChinaAMC A-Share ETF | 18.4% |
| PAXX | Platinum Asia Fund (Quoted Managed Hedge Fund) | 12.6% |
| GMTL | Global X Green Metal Miners ETF | 12.5% |
1 Since February 2023, the ASX started reporting additional data on a CHESS-only basis. The primary use of such data is that it will exclude, amongst other things, the FuM and Flows in ‘dual class’ Active ETFs and potentially provide a more accurate picture of exchange traded activity.
Explore
ETF industry


