3 minutes reading time
Reading time: 2 minutes
October 2022: ETF INDUSTRY ROARS BACK TO GROWTH AS SHAREMARKETS RALLY
With global and Australian sharemarkets staging a dramatic comeback in October, the Australian ETF industry grew significantly. Read on for details, including best performers, asset flow categories and more.
Market cap
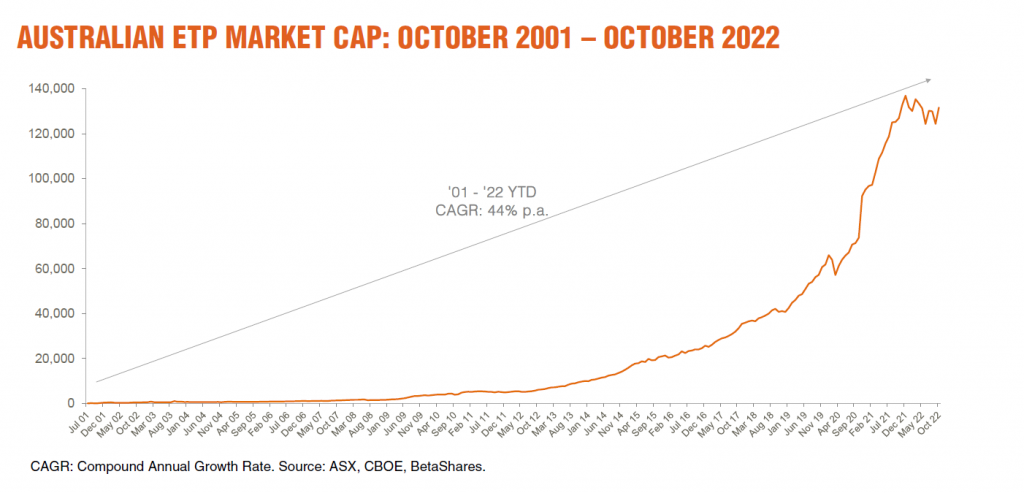
- Australian Exchange Traded Funds Market Cap: $131.7B
- Market cap increase for month: 5.9%, $7.3B – all time biggest $ value growth on record1
- Market cap growth for the last 12 months: 3.7%, $4.8B
Comment: The industry ended the month at $131.7B, which is still some $5B off the peak level of $136.9B recorded in December ’21.
New money
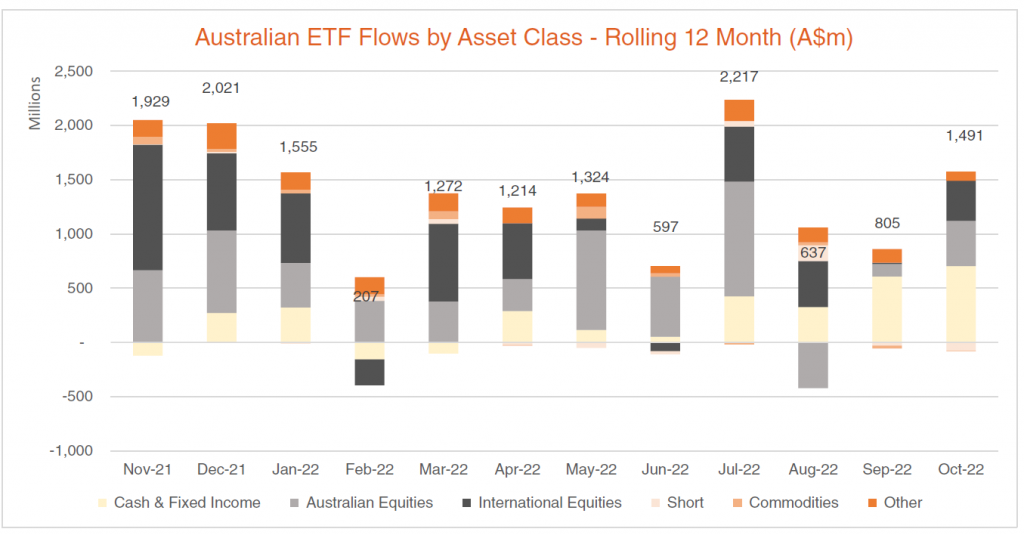
- Net flows for month: +$1.5B
Comment: The sharemarket rise contributed the bulk of the industry growth this month, with 20% of the growth attributable to net flows (net new money), which were relatively robust at $1.5B.
Products
- 311 Exchange Traded Products trading on the ASX.
- 8 new product launched this month, including our XMET Energy Transition Metals ETF and QMAX Nasdaq 100 Yield Maximiser Fund (managed fund) , and new passive products from Global X and Van Eck. We also saw three new Active ETF issuers join the industry: Abrdn, Hejaz and Firetrail.
- Cosmos delisted their Crypto Equities fund, DIGA, with their two other cryptocurrency ETFs expected to delist in November.
Trading value
- ASX ETF trading value increased 17% month on month, for a total of $10.7 billion.
Performance
- With sharemarkets rallying strongly, the GGUS Geared U.S. Equity Fund – Currency Hedged (hedge fund) topped the charts for performance this month, returning 19.4%, followed by our Cosmos-Purpose Ethereum Access ETF at 18.0%.

Top 5 category inflows (by $) – October 2022
| Category | Inflow Value |
| Australian Equities | $417,624,868 |
| Cash | $396,625,328 |
| International Equities | $369,141,545 |
| Fixed Income | $308,576,596 |
| Listed Property | $53,949,336 |
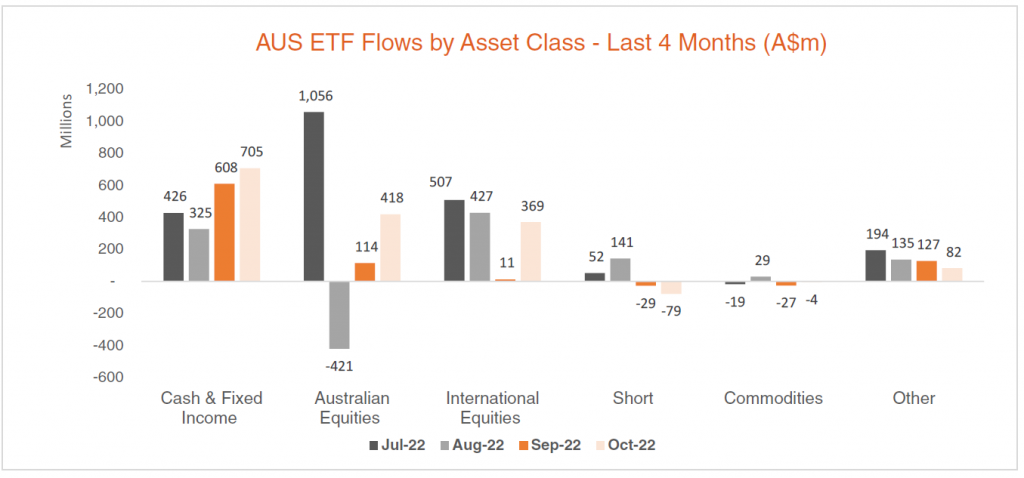
Comment: The market rally saw net inflows recorded in all major asset classes, with the composition of the flows being quite balanced. Australian Equities was the category with the highest flows at $417m, but we saw strong flows into Cash, International Equities and Fixed Income as well ($396m, $369m and $308m respectively).
Top category outflows (by $) – October 2022
| Category | Inflow Value |
| Short | ($78,702,313) |
| Currency | ($19,355,116) |
| Commodities | ($4,231,120) |
Comment: Overall net flows at a category level were muted, and largely confined to selling in short exposures, particularly the short Nasdaq 100 fund.

Source: Bloomberg, Betashares.
Top sub-category inflows (by $) – October 2022
| Sub-category | Inflow Value |
| Cash | $396,625,328 |
| Australian Equities – Broad | $282,188,883 |
| Australian Bonds | $198,641,150 |
| International Equities – US | $189,892,844 |
| International Equities – Developed World | $118,828,999 |
Top sub-category outflows (by $) – October 2022
| Sub-category | Inflow Value |
| US Equities – Short | ($87,076,106) |
| International Equities – Europe | ($68,269,958) |
| Currency | ($19,355,116) |
| Other | ($5,807,029) |
| International Equities – Emerging Markets | ($3,789,556) |

