Betashares Australian ETF Review: November 2024
6 minutes reading time
Better investing starts here
Get Betashares Direct
Betashares Direct is the new investing platform designed to help you build wealth, your way.
Scan the code to download.
Learn more
Learn more
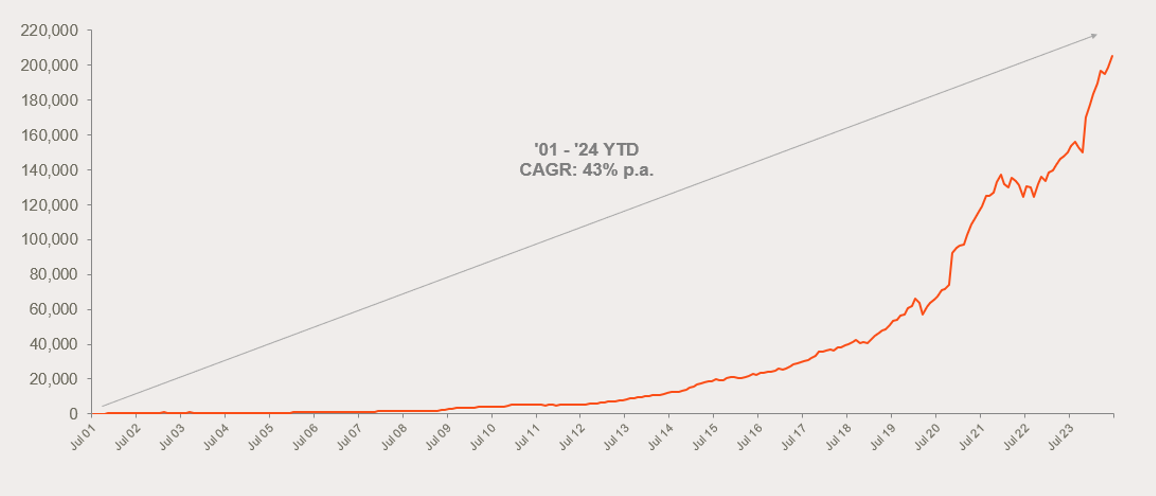
Australian ETF Industry passes $200 billion in assets
- The Australian ETF industry ended the financial year on another record high, reaching the $200 billion mark in total assets under management after recording robust growth for the half year.
- The ETF industry continues to go from strength to strength, as investors increasingly adopt ETFs to build their portfolios.
- FUM: The Australian ETF industry increased in size by 15.7% for the Half, recording total growth of $27.8B for the Half, to end the financial year at $205.3B, a new all-time industry record.
- Net Flows: ETF industry flows were very strong over the half, with net new money sitting at $11.0B, more than double the $4.8B of net flows received in the first half of It compares very favourably to unlisted funds: Morningstar data shows that Australian unlisted funds have seen outflows of $3.8B over the same period, demonstrating a clear investor preference for exchange traded funds that is consistent with historical trends in Australia and overseas.
- Trading: ETF trading values were robust for the Half – at 14% higher than the first half of 2023, showing continued adoption of the investment vehicle.
- Issuer Flows: Betashares was the #1 issuer for net flows in the first half with ~$3.0B in net Flow concentration by issuer remains elevated but is subsiding from very high levels last year, with the top 3 issuers (Betashares, Vanguard and iShares) receiving just under 80% of the industry flows for the Half.
- Product launches: Product development activity was elevated this Half, with 36 new products launched (compared to 22 for the first half of 2023). This included 4 new issuers entering the market, all of which were Active ETF issuers.
- Flows by Product Type: Despite multiple new Active ETFs, this Half we again saw the Active ETF category in cumulative net outflow, driven primarily by large flows out of one Magellan As such it was very much market-capitalisation passively managed product that led the way flows-wise.
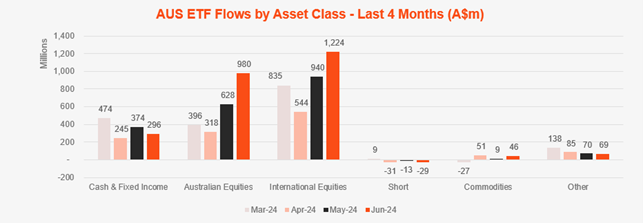
- Flows by Category: There has been a distinct shift in sentiment this year from 2023, with International and Australian equities returning to their places as the preferred asset classes for ETF investors, receiving $5.6 billion and $3.3 billion of inflows After receiving the most interest last year, fixed income rounds out the top three with $1.8 billion in net inflows.
- International Equities exposures received $5.6B of inflows
- Australian Equities exposures received $3.3B of inflows
- Fixed Income exposures recorded $1.8 of inflows
- Small outflows were recorded in Cash, Short and Commodity ETFs as growth sentiment returned to the market
- Performance: Growth exposures performed very strongly, causing such products to dominate the performance table for the first 6 months of the year. Given the resurgence of interest in crypto and technology, it was those exposures, as well as Geared US Shares ETFs that performed the best.
- Industry Forecast: At the end of 2023 (when the industry was $183B) we forecast the industry to end 2024 in excess of $220B – we now forecast the industry to hit $230B by the end of the year, a small increase on last year’s projections. Longer term, we expect ETF industry FUM to increase by 150% to $500 billion in the next five years.
Market Size and Growth: Half Year 2024

Source: ASX, CBOE
Market Cap
- Australian Exchange Traded Funds Market Cap (ASX + CBOE): $205.3B – new all time high
- ASX CHESS Market Cap: $174.6B1
- Market Cap increase for Half: 15.7%, $27.8B
- Market cap growth for last 12 months: 39.2%, $57.8B
Net Flows
- Net flows for the Half Year: $11.0B (129% more than the $4.8B recorded in the first half of 2023)
New Products
- 382 Exchange Traded Products trading on the ASX & CBOE
- New/closed products: 36 new products launched in the half year (compared to 22 in first half 2023), 21 products closed.
- 4 new issuers joined the market (compared to 3 in the first half of 2023).
- There are currently 50 issuers of ETFs in Australia.
Trading Value
- Trading value for this half was 14% lower than the first half of 2023.
Industry Net Flows

Top Category Inflows (by $) – Month
| Broad Category | Inflow Value |
| International Equities | $1,223,698,258 |
| Australian Equities | $979,820,445 |
| Fixed Income | $239,200,889 |
| Cash | $56,560,977 |
| Commodities | $45,564,854 |
Top Category Outflows (by $) – Month
| Broad Category | Inflow Value |
| Short | ($29,411,575) |
Top Sub-Category Inflows (by $) – Month
| Sub-category | Inflow Value |
| Australian Equities – Broad | $824,353,914 |
| International Equities – Developed World | $505,460,830 |
| International Equities – US | $325,451,622 |
| Australian Bonds | $181,842,062 |
| International Equities – Emerging Markets | $163,979,492 |
Top Sub-Category Outflows (by $) – Month
| Sub-category | Inflow Value |
| US Equities – Short | ($22,730,934) |
| Australian Equities – Short | ($6,680,640) |
| International Equities – Asia | ($6,048,381) |
| Oil | ($4,852,237) |
| International Listed Property | ($4,725,069) |
Performance
Top Performing Products – Month
| Ticker | Product Name | Performance (%) |
| LNAS | Global X Ultra Long Nasdaq 100 Hedge Fund | 13,6% |
| FANG | Global X FANG+ ETF | 9.1% |
| IKO | iShares MSCI South Korea Capped Index ETF | 7.7% |
| GGUS | Betashares Geared US Equity Fund Currency Hedged (Hedge Fund) | 7.5% |
| HYGG | Hyperion Global Growth Companies Fund (Managed Fund) | 7.3% |
Top 10 Products: Half Year 2024
By Market Cap
| Ticker | Product | Issuer | Market Cap | Rank Movement |
| VAS | Vanguard Australian Shares Index ETF | Vanguard | $15,316,737,407 | |
| IVV | iShares S&P 500 ETF | iShares | $8,320,129,249 | |
| VGS | Vanguard MSCI Index International Shares ETF | Vanguard | $8,136,003,527 | |
| MGOC | Magellan Global Fund (Open Class) (Managed Fund) | Magellan | $6,264,819,169 | |
| QUAL | VanEck MSCI World Ex-Australia Quality ETF | VanEck | $6,230,183,585 | |
| IOZ | iShares Core S&P/ASX 200 ETF | iShares | $5,681,831,109 | |
| STW | SPDR S&P/ASX 200 | State Street | $5,201,451,344 | |
| A200 | Betashares Australia 200 ETF | Betashares | $5,189,657,905 | |
| NDQ | Betashares NASDAQ 100 ETF | Betashares | $5,092,097,107 | +1 |
| DACE | Dimensional Australian Core Equity Trust (Managed Fund) | Dimensional | $5,061,697,124 | -1 |
Top Performing Products – Half Year 2024
| Ticker | Product Name | Performance |
| EETH | Global X 21Shares Ethereum ETF | 48.6% |
| EBTC | Global X 21Shares Bitcoin ETF | 46.1% |
| MCCL | Munro Climate Change Leaders Fund (Managed Fund) | 40.3% |
| SEMI | Global X Semiconductor ETF | 38.8% |
| LNAS | Global X Ultra Long Nasdaq 100 Hedge Fund | 33.7% |
| FANG | Global X FANG+ ETF | 32.5% |
| GGUS | Betashares Geared US Equity Fund Currency Hedged (Hedge Fund) | 29.4% |
| ETPMAG | Global X Physical Silver | 25.8% |
| MCGG | Munro Concentrated Global Growth Fund (Managed Fund) | 25.4% |
| LPGD | Loftus Peak Global Disruption Fund (Managed Fund) | 25.0% |
Footnotes
1. Since February 2023, the ASX started reporting additional data on a CHESS-only basis. The primary use of such data is that it will exclude, amongst other things, the FuM and Flows in ‘dual class’ Active ETFs and potentially provide a more accurate picture of exchange traded activity. ↑
Explore
ETF industry


