Betashares Australian ETF Review: March 2025
4 minutes reading time
Better investing starts here
Get Betashares Direct
Betashares Direct is the new investing platform designed to help you build wealth, your way.
Scan the code to download.
Learn more
Learn more
Record net flows push ETF Industry to new all-time high
- The highest monthly net flows on record pushed the Australian ETF Industry to a new all-time high in assets under management.
- July saw the ETF industry continue the strong momentum from the first half of 2024, as record net flows and strong market performance lifted the industry to a new all-time high. The industry rose by 5% for the month, with total market cap increasing by $10.3B. Total industry assets now stand at $215.6B – a new all-time record high.
- Industry flows were a record $3.5B for the month – continuing the long running trend of investors using the new financial year as an opportunity to add to their portfolios. It was the first time that monthly flows have exceed $3B, with the previous record of $2.9B being set in September 2021. Net flows represented ~33% of the monthly growth, with the remainder coming from market appreciation and conversion activity.
- While these numbers reflect the ETF industry prior to the August market dip, early indications suggest that ETF investors are taking advantage of the current high levels of volatility with nearly $1B in net flows already recorded for August.
- ASX trading value was ~$14B for the month – the second highest value on record for monthly ETF trading volumes.
- Over the last 12 months the Australian ETF industry has grown by 43.7%, or $65.6B.
- In terms of product launches, there were 6 new funds launched in July, including a new currency hedged Equal Weight S&P 500 exposure, HQUS S&P 500 Equal Weight Currency Hedged ETF , and a new Australian Equities Momentum ETF, MTUM Australian Momentum ETF . Magellan also converted their closed ended MGF fund into units in MGOC, further adding to the industry FuM figure.
- The best performing ETFs this month were exposures over US small caps, cryptocurrencies and gold miners.
- July was a stand out month for International Equities products ($1.6B), as they received almost double the amount of net flows of the second placed Australian Equities products ($891 million). Fixed income was in third spot with $746 million.
- Outflows were limited to very small amounts in Cash and Listed Property funds.
Australian ETF Industry AuM: July 2001 – July 2024
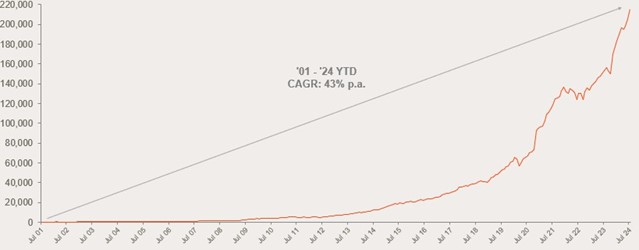
CAGR: Compound Annual Growth Rate. Source: ASX, CBOE
Market Cap
- Australian Exchange Traded Funds Market Cap (ASX + CBOE): $215.6B – all time high
- ASX CHESS Market Cap: $183.8B1
- Market Cap change for July: 5%, $10.3B
- Market cap growth for last 12 months: 7%, $65.6B
New Money
- Net inflows for month: $3.5B – all time high
Products
- 388 Exchange Traded Products trading on the ASX & CBOE
- 6 new funds were launched in July, including a new currency hedged Equal Weight S&P 500 exposure and a new Australian Equities Momentum ETF.
Trading Value
- ASX trading value was ~$14B for the month – the second highest number for ETF trading
Performance
- The best performing ETFs this month were exposures over U.S. small caps, cryptocurrencies and gold miners.
Industry Net Flows
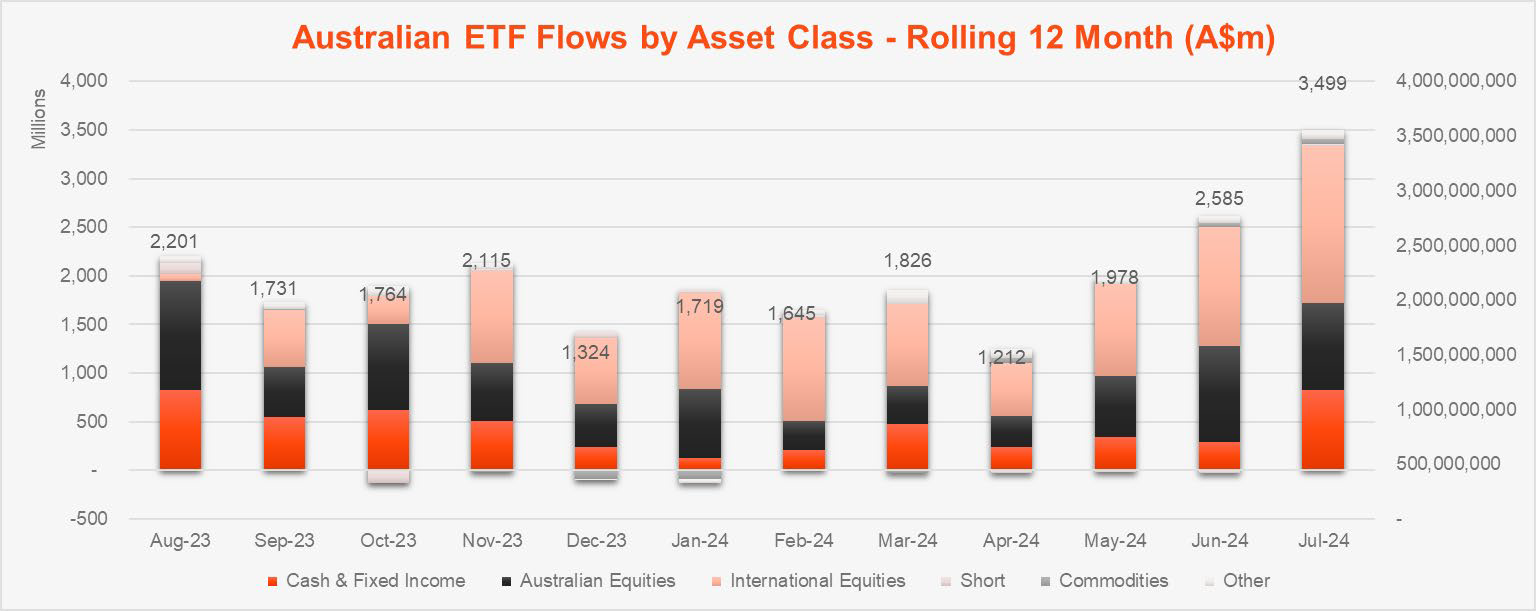
Top Category Inflows (by $) – Month
| Broad Category | Inflow Value |
| International Equities | $1,615,498,623 |
| Australian Equities | $890,920,238 |
| Fixed Income | $862,934,188 |
| Multi-Asset | $79,420,060 |
| Commodities | $49,896,083 |
Top Category Outflows (by $) – Month
| Broad Category | Inflow Value |
| Cash | ($32,287,087) |
| Listed Property | ($14,379,012) |

Top Sub-Category Inflows (by $) – Month
| Sub-Category | Inflow Value |
| International Equities – Developed World | $841,707,127 |
| Australian Equities – Broad | $745,543,072 |
| Australian Bonds | $574,642,472 |
| Global Bonds | $285,343,572 |
| International Equities – Sector | $253,458,374 |
Top Sub-Category Outflows (by $) – Month
| Sub-Category | Inflow Value |
| Cash | ($32,287,087) |
| Australian Listed Property | ($28,195,853) |
| Australian Equities – Geared | ($14,086,904) |
| International Equities – E&R – Impact | ($4,491,418) |
| Australian Equities – Sector | ($4,472,486) |
Performance
Top Performing Products – Month
| Ticker | Product Name | Performance (%) |
| IJR | iShares S&P Small-Cap ETF | 13.5% |
| GDX | VanEck Gold Miners ETF | 13.4% |
| EBTC | Global X 21Shares Bitcoin ETF | 11.6% |
| MNRS | Betashares Global Gold Miners ETF – Currency Hedged | 11.4% |
| VBTC | VanEck Bitcoin ETF | 11.3% |
1 Since February 2023, the ASX started reporting additional data on a CHESS-only basis. The primary use of such data is that it will exclude, amongst other things, the FuM and Flows in ‘dual class’ Active ETFs and potentially provide a more accurate picture of exchange traded activity.
Explore
ETF industry
