
Matthew Reeves
3 minutes reading time
Rare dip for ETF assets, despite strong flows
-
The Australian ETF industry recorded a rare dip in terms of assets, as positive inflows were not enough to offset global sharemarket declines during February
-
February saw ETF industry assets fall less than one per cent (-0.81%) month-on-month, for a total monthly market cap decline of $2.1B. The industry now sits at $255.3B – just shy of the all time high set last month
-
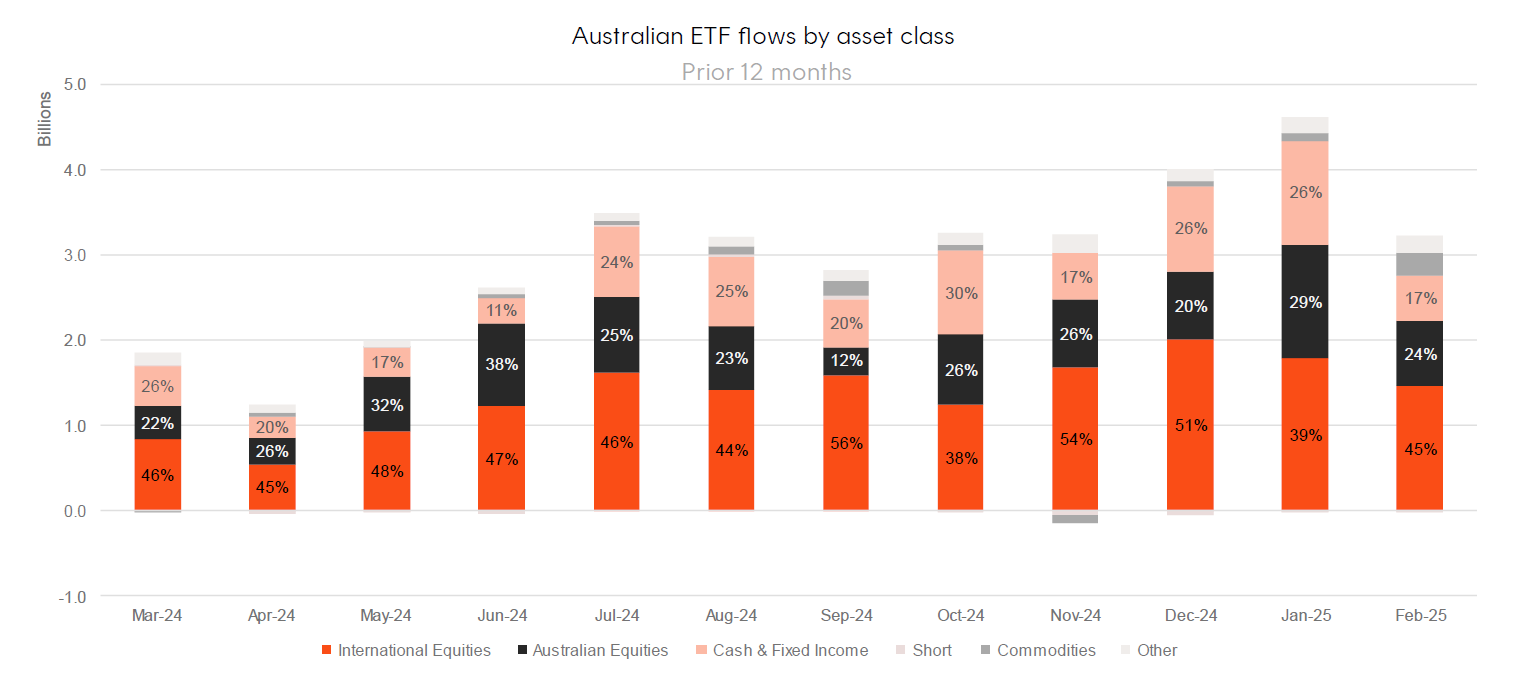
Notwithstanding market volatility, industry flows remained positive – with $3.2B of net flows for the month. February marks the fifth consecutive month where the industry recorded flows above the $3B mark
-
ASX trading value was 8% higher month on month, sitting at $13B for February
-
Over the last 12 months the Australian ETF industry has grown by 34.8%, or $66.0B
-
Product launches returned with 11 new funds launched in February, including a new Bitcoin exposure and the first Ethereum ETF on the ASX
-
A Chinese equities related exposure topped the performance charts last month, followed by a short Australian equities fund (ASX: BBOZ) and a leveraged US Treasury Bond Fund (ASX: GGFD)
-
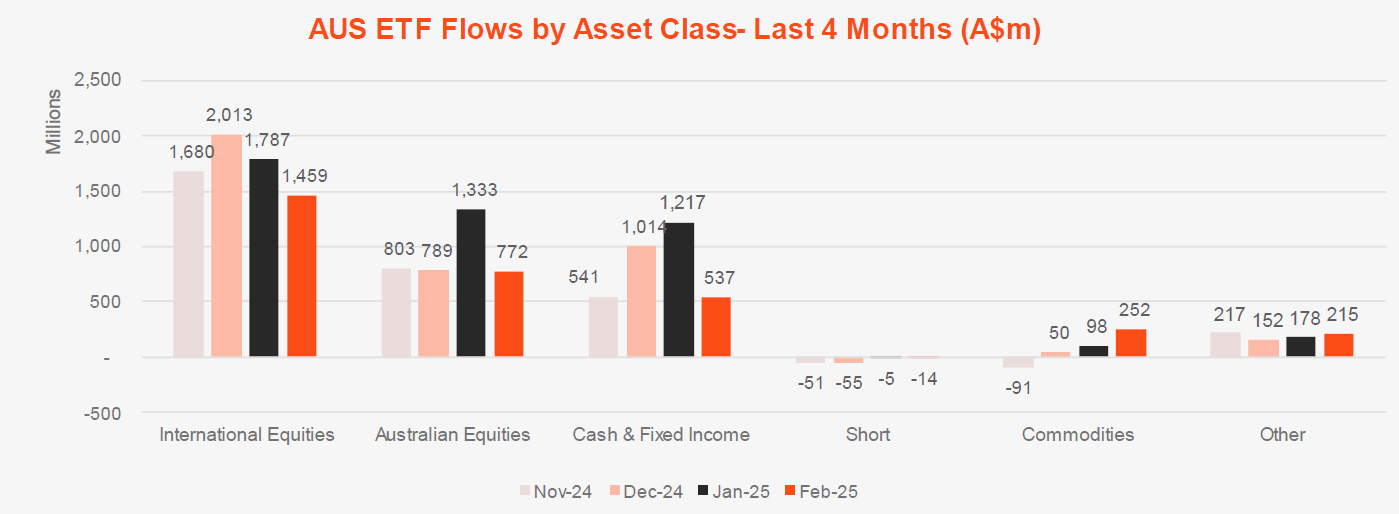
International Equities products ($1.5B) maintained their strong lead over Australian Equities ($722 million) and Fixed Income ($500 million).
Market Size and Growth: February 2025
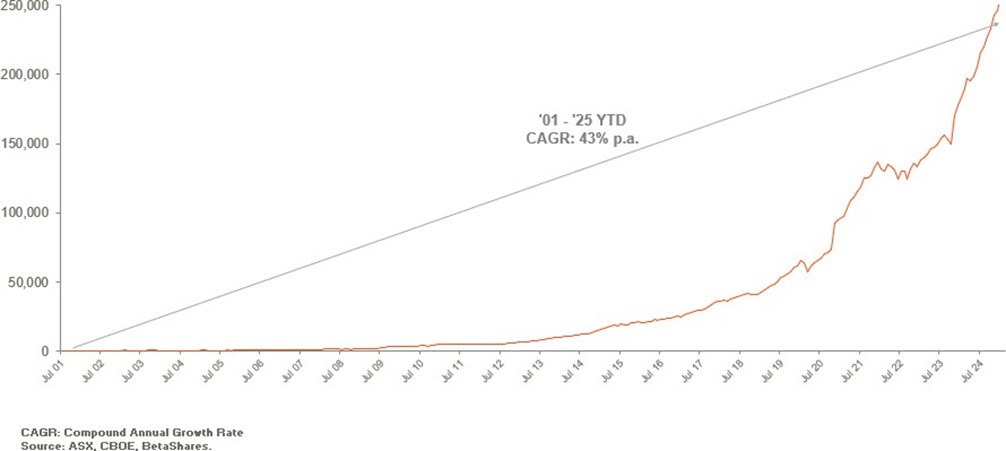
CAGR: Compound Annual Growth Rate. Source: ASX, CBOE
Market Cap
- Australian Exchange Traded Funds Market Cap (ASX + CBOE): $255.3B
- ASX CHESS Market Cap: $217.69B1
- Market Cap change for February: -0.81%, -$2.08B
- Market cap growth for last 12 months: 34.8%, or $66.0B
New Money
- Net inflows for month: $3.2B
Products
- 407 Exchange Traded Products trading on the ASX & CBOE
- Product launches returned with 11 new funds launched in February, including a new Bitcoin exposure and the first Ethereum ETF on the ASX
Trading Value
- ASX trading value was 8% higher month on month, sitting at $13B for February
Performance
- A Chinese equities related exposure topped the performance charts last month, followed by a short Australian equities fund ( BBOZ Australian Equities Strong Bear Complex ETF ) and a leveraged US Treasury Bond Fund ( GGFD Geared Long US Treasury Bond Currency Hedged Complex ETF )
Industry Net Flows
Top Category Inflows (by $) – Month
| Broad Category | Inflow Value |
|---|---|
| International Equities | $1,459,267,772 |
| Australian Equities | $772,181,854 |
| Fixed Income | $500,432,601 |
| Commodities | $252,030,073 |
| Multi-Asset | $94,798,519 |
Top Sub-Category Inflows (by $) – Month
| Sub-Category | Inflow Value |
|---|---|
| International Equities – Developed World | $835,283,318 |
| Australian Equities – Broad | $645,505,671 |
| Australian Bonds | $436,810,574 |
| International Equities – US | $398,870,717 |
| Gold | $239,788,738 |
Top Sub-Category Outflows (by $) – Month
| Sub-Category | Inflow Value |
| Fixed Income – E&R – Ethical | -$103,182,317 |
| Australian Equities – Sector | -$44,939,167 |
| Australian Equities – Short | -$20,278,149 |
| Australian Equities – E&R – Impact | -$138,298 |
Performance
Top Performing Products – Month
| Ticker | Product Name | Performance (%) |
| IZZ | iShares FTSE China Large-Cap ETF | 11.87% |
| BBOZ | Betashares Australian Equity Strong Bear Fund (managed fund) | 11.60% |
| GGFD | Betashares Geared Long U.S. Treasury Bond Fund – Currency Hedged (Hedge Fund) | 7.32% |
| GAME | Betashares Video Games and Esports ETF | 6.43% |
| DTEC | Global X Defence Tech ETF | 6.35% |
1 comment on this
what is your Cu ETF?