Betashares Australian ETF Review: November 2024
3 minutes reading time
February 2023 Review: Investor flows push industry to a new high, even as markets decline
The Australian ETF Industry’s FuM growth was positive, albeit slow, at 0.9% month-on-month, for a total monthly market cap increase of $1.3B. Read on for details, including best performers, asset flow categories and more.
Exchanged Traded Funds Market cap
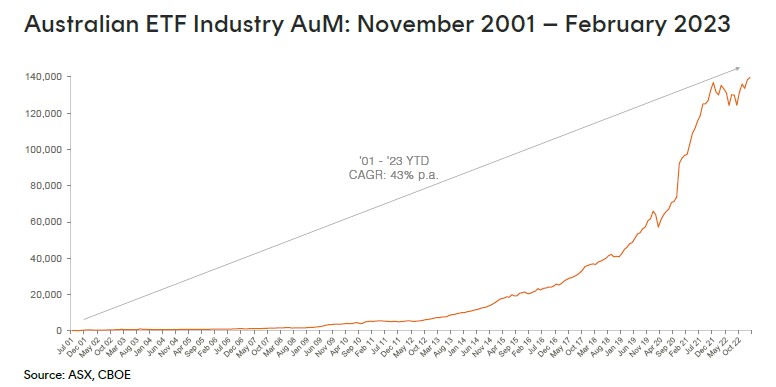
- Australian Exchange Traded Funds Market Cap(ASX + CBOE): $139.7B – new all time high
- Market cap increase for month: 0.9%, $1.3B
- Market cap growth for last 12 months: 7.4%, $9.7B
Comment: Notwithstanding falling sharemarkets investors continued to allocate to ETFs, with net inflows causing the industry to once again set a new all-time high in funds under management (FuM).
New money
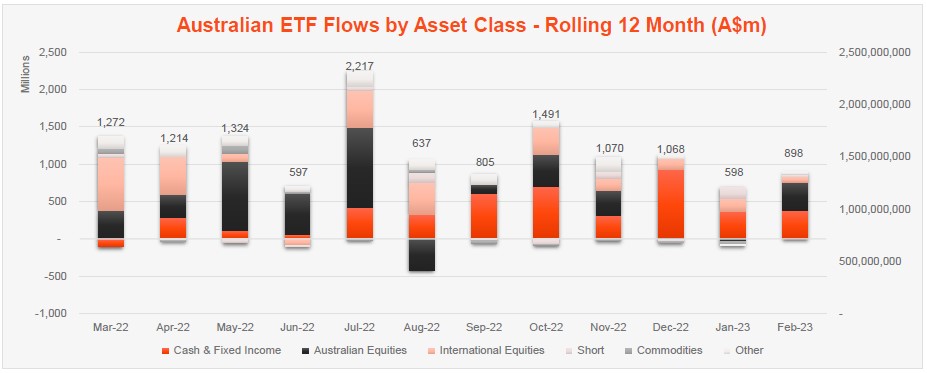
- Net inflows for month: +$0.9B
Comment: Unlike last month, in February, the majority of the industry’s growth came from net flows (net new money) which contributed ~70% of the monthly growth.
Products
- 325 Exchange Traded Products trading on the ASX
- 4 new products launched this month 3 covered call ETFs from Global X and a new ‘Global Transition” Active ETF from Platinum
Trading value
- ASX ETF trading value increased 528% for the month, for a total of $9B
Performance
As both global and Australian sharemarkets declined, the U.S. dollar rallied, with the leveraged US Dollar Fund, YANK Strong U.S. Dollar Fund (hedge fund) topping the performance tables, with ~11% return for the month. Carbon credits exposures also performed strongly rising ~9% for the month.

Top 5 category inflows (by $) – February 2023
| Broad Category | Inflow Value |
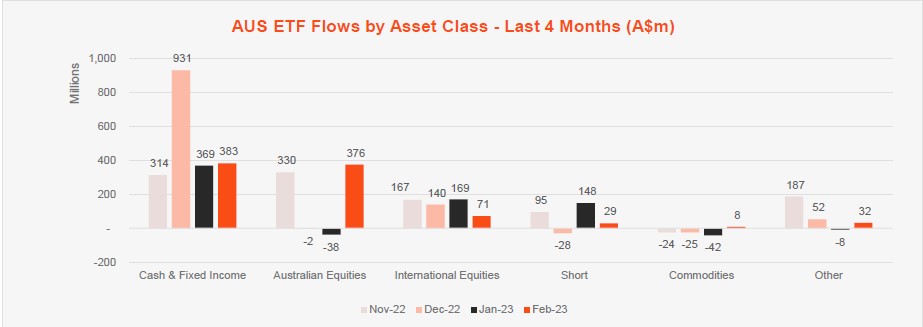
| Australian Equities | $375,829,518 |
| Fixed Income | $370,424,766 |
| International Equities | $71,242,183 |
| Short | $28,663,192 |
| LIsted Property | $25,880,628 |
Top category outflows (by $) – February 2023
| Sub-Category | Inflow Value |
| Currency | ($4,157,843) |
Comment: Unlike January, this month we saw considerable interest in broad market Australian equities ETFs ($375m inflows), with investors seemingly taking the view that the ‘lucky country’ remains in a better position economically than other developed global markets. Fixed income exposures continue to remain popular receiving $370m of net flows.

Top sub-category inflows (by $) – February 2023
| Sub-category | Inflow Value |
| Australian Equities – Broad | $135,908,948 |
| Australian Equities Bonds | $100,372,366 |
| Global Bonds | $98,498,916 |
| International Equities – US | $97,284,639 |
| International Equities – E&R – Ethical | $97,127,400 |
Top sub-category outflows (by $) – February 2023
| Sub-Category | Inflow Value |
| International Equities – Europe | ($75,220,333) |
| International Equities – Developed World | ($70,567,366) |
| Australian Equities – E&R – Ethical | ($58,215,662) |
| International Equities – Asia | ($36,301,175) |
| Australian Equities – Short | ($10,437,440) |
It is notable that although inflows remain relatively muted compared to previous years, we are not seeing any major outflows across the industry. The exception to this has been Active ETFs, where ~$300m of outflows have been recorded to date this year.
*Past performance is not an indicator of future performance.


2 comments on this
How about posting some performance data?
Hi Mike,
The purpose of the ETF Review is to provide data on flows of money in and out of ETFs across the industry. If you’d like to view performance data this is available at the relevant fund pages.
Regards,
Patrick