5 minutes reading time
Records tumble as ETF growth accelerates
-
The Australian ETF industry recorded its highest annual funds under management (FUM) increase in 2024, breaking new records in terms of assets and net flows
-
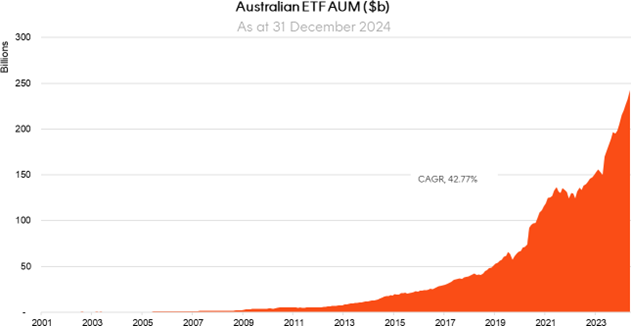
FUM: The Australian ETF industry ended the year at an all time high, with the total industry market capitalisation sitting at $246.3B, representing 38.8% year on year growth. The industry grew $68.9B in 2024 – an industry record in terms of $ annual growth
-
Net Flows: ETF industry flows smashed the record set in 2021, with net new money for the year of $30.8B, doubling the $15B of net flows received in 2023
-
Trading: The Australian ETF industry continued to experience strong trading values, annual ASX ETF trading value increased 23% on 2023. In total, a record $141B of ETF value was traded on the ASX (compared to $114B in 2023)
-
Issuer Flows: Flows remain concentrated. Vanguard, Betashares and iShares were the top three issuers in terms of flows this year, recording ~$24.4B in net inflows between them. Collectively the top 3 issuers this year (Vanguard, Betashares and iShares) accounted for nearly 80% of industry flows
-
Product Launches: In terms of product launches, 2024 was the biggest year on record, with 66 new ETFs launched on Australian exchanges
-
Active/Passive flows: In terms of product types, 2024 was all about passive investing, notably with
~$847 million in outflows recorded in Active ETFs. Market-cap index-tracking funds once again dominated over smart-beta alternatives, although the smart beta category received 21% of total flows -
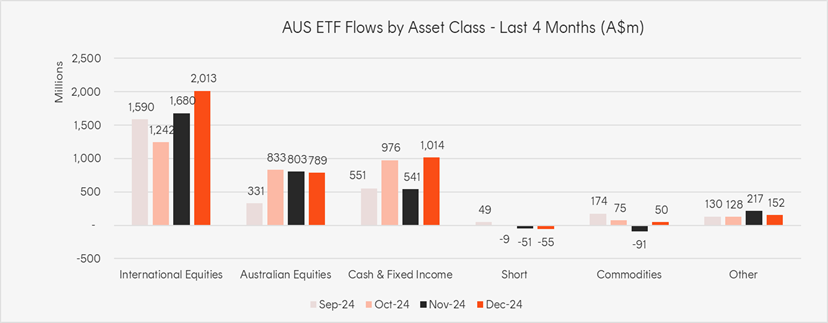
Flows by Category: Investors returned to International Equities in a big way after taking a more defensive stance in 2023. To that end, International Equities were the number one broad category for inflows in 2024, followed by Australian Equities and then Fixed Income ETFs
-
International equities ETFs roared back to first place receiving $15.1B of net inflows (v. $2.9B in 2023)
-
Australian Equities ETFs came in 2nd with $7.1B in flows (v. $5.2B in 2023)
-
Fixed Income ETFs came in 3rd, with $6.1B received. (v. $5.3B in 2023)
-
- Performance: After a strong year for growth exposures, it was crypto and technology focussed ETFs that topped the performance tables for the ETF industry for 2024
- Industry Forecast: In our year-end report for 2023, we wrote: “In terms of 2024, we believe that the industry will continue to benefit from increased investor adoption and inflows combined with positive markets. As such, we forecast total industry FuM at end 2024 to exceed $200B and could reach as high as $220B depending on market conditions.”
While we were correct regarding positive inflows and market growth, we underestimated the scale of net flows by some margin, while market conditions were very conducive for growth exposures which contributed strongly to the growth in market size.
- Looking ahead, we expect the ETF industry will exceed $300B by the end of 2025 should market conditions remain positive
Market Size and Growth: End of Year 2024

CAGR: Compound Annual Growth Rate. Source: ASX, CBOE
Market Cap
- Australian ETFs Market Cap (ASX + CBOE): $246.3B – new all time high
- ASX CHESS Market Cap: $209.3B1
- Market Cap increase for the year: 38.8%, $68.9B – industry record $ annual growth
Net flows
- Net flows for the year: $30.8B – doubling the $15B of net flows received in 2023
Issuers and Products
- 403 Exchange Traded Products trading on the ASX & CBOE
- New/closed products: 66 new products launched in the half year (compared to 56 in 2023), 30 products closed (compared to 8 closures in 2023)
- There are currently 53 issuers of ETFs in Australia
Trading Value
- Annual ASX trading value was a record $141B (23% higher compared to 2023)
Performance
- After a strong year for growth exposures, it was crypto and technology focussed ETFs that topped the performance tables for the ETF industry for 2024
Industry Net Flows

Top Category Inflows (by $) – Month
| Broad Category | Inflow Value |
|---|---|
| International Equities | $2,012,954,993 |
| Australian Equities | $789,103,704 |
| Fixed Income | $763,735,077 |
| Cash | $249,827,208 |
| Multi-Asset | $118,952,522 |

Top Sub-Category Inflows (by $) – Month
| Sub-Category | Inflow Value |
|---|---|
| Australian Equities – Broad | $961,645,840 |
| International Equities – US | $792,510,844 |
| International Equities – Developed World | $705,687,759 |
| Australian Bonds | $625,266,408 |
| International Equities – E&R – Ethical | $292,500,955 |
Top Sub-Category Outflows (by $) – Month
| Sub-Category | Inflow Value |
|---|---|
| Australian Equities – E&R – Ethical | -$249,918,042 |
| Australian Listed Property | -$156,442,924 |
| Australian Equities – Short | -$52,837,849 |
| Australian Equities – Large Cap | -$32,645,625 |
| International Equities – Asia | -$32,021,313 |
Performance
Top Performing Products – Month
| Ticker | Product Name | Performance (%) |
|---|---|---|
| YANK | YANK Strong U.S. Dollar Fund (hedge fund) | 13.16% |
| FANG | Global X FANG+ ETF | 11.36% |
| BBOZ | BBOZ Australian Equities Strong Bear Hedge Fund | 9.70% |
| IZZ | iShares FTSE China Large-Cap ETF | 9.24% |
| BBFD | BBFD Geared Short U.S. Treasury Bond Fund – Currency Hedged (hedge fund) | 9.06% |

