Australian ETF industry breaks more records
3 minutes reading time
April 2023 Review: Investor flows push industry to a new high, even as markets decline
The strong rise in global sharemarkets together with continued investor flows allowed the Australian ETF industry to once again set a new all-time high in funds under management (FuM). Read on for details, including best performers, asset flow categories and more.
Exchanged Traded Funds Market cap
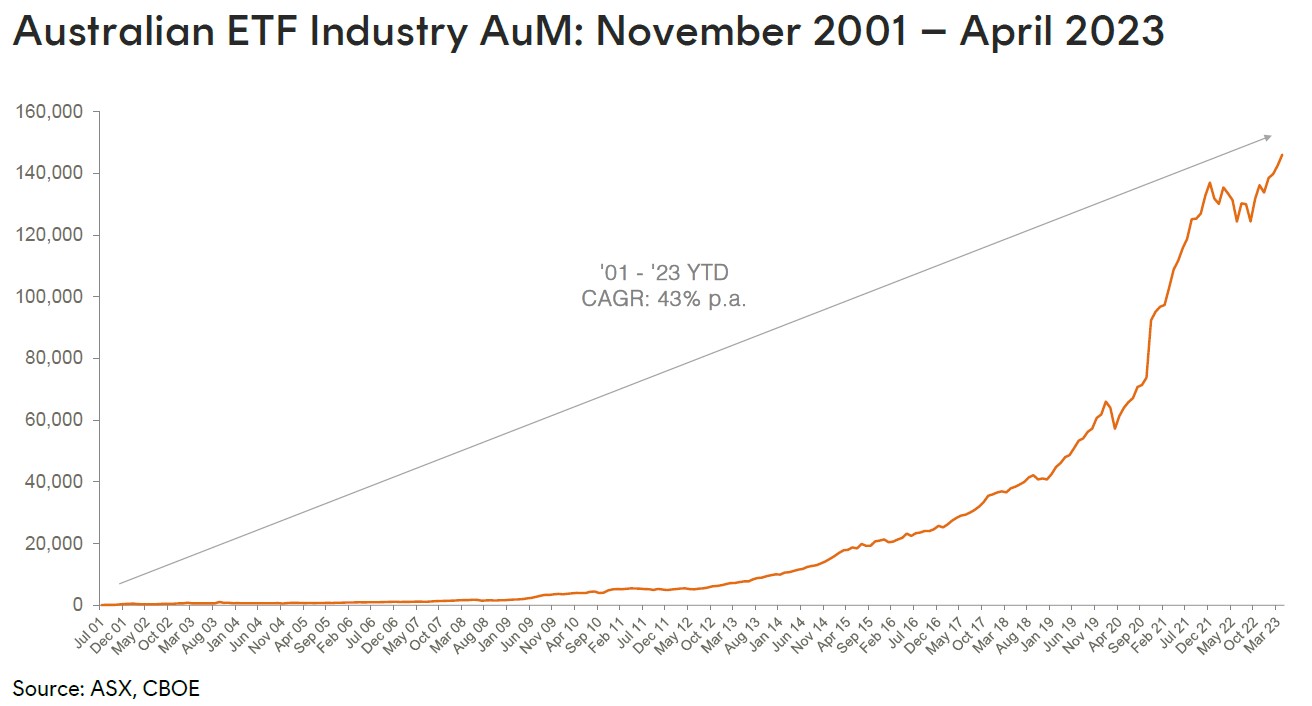
- Australian Exchange Traded Funds Market Cap(ASX + CBOE): $146.0B – new all time high
- ASX CHESS Market Cap: $131.0B1
- Market cap increase for month: 2.4%, $3.4B
- Market cap growth for last 12 months: 9.4%, $12.5B
Comment: The Australian ETF Industry’s FuM grew by 2.0% month-on-month, for a total monthly market cap increase of $2.8B. Industry funds under management ended the month at $142.6B, a new record high.
New money
- Net inflows for month: +$0.8B
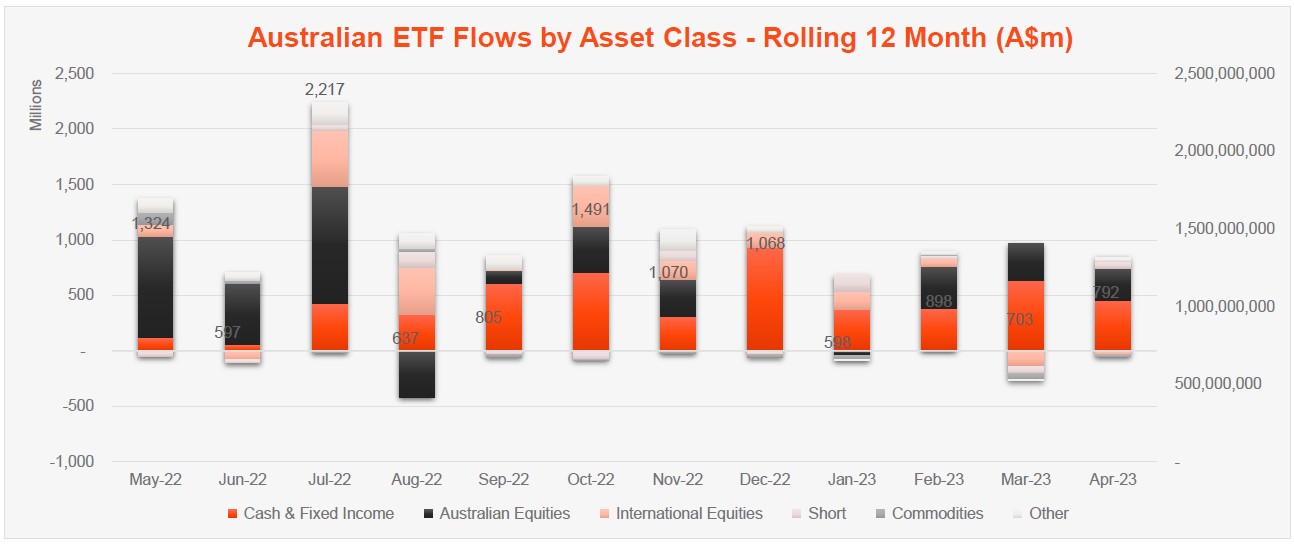
Comment: The growth this month came primarily from asset value appreciation, although investor flows remained positive, at $0.7B (25% of the monthly growth).
Products
- 329 Exchange Traded Products trading on the ASX
- 2 new products launched this month, being Australian shares and fixed income ETFs, both from Global X
Trading value
-
-
- ASX ETF trading value decreased for a full 42% for the month, for a total of $6.5B, the lowest level for over 2 years.
-
Comment: Over the last 12 months, we’ve seen the industry grow in size, albeit at a far slower pace than previous years – with an increase of 5.3% year on year, or $7.2B
Performance
The best performing products in April were Physical Platinum and our Crypto Innovators ETF (ASX: CRYP) both of which returned ~10% for the month
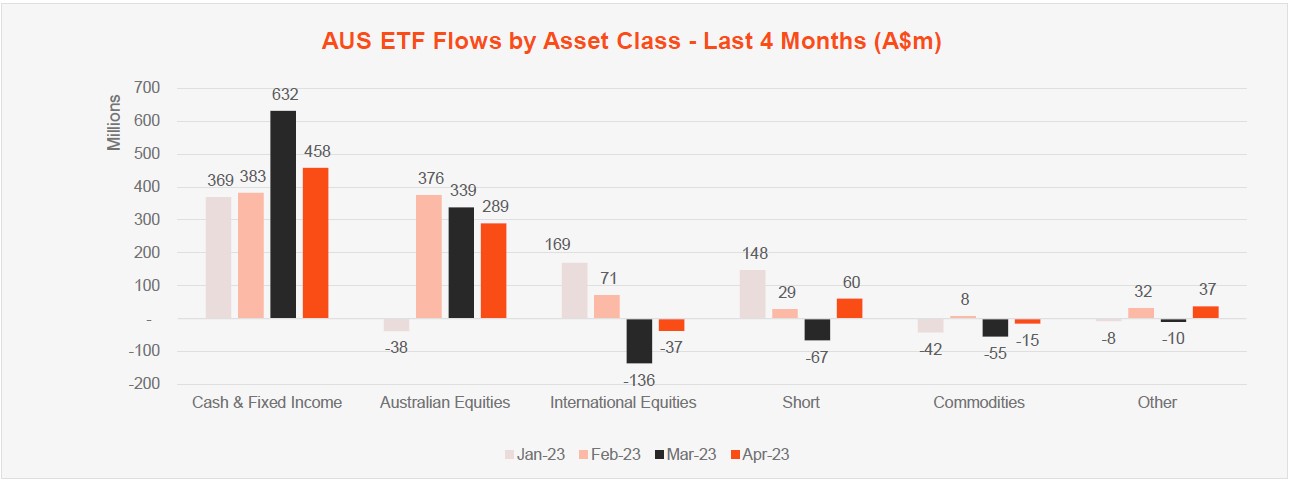
Top 5 category inflows (by $) – April 2023
| Broad Category | Inflow Value |
| Fixed Income | $371,638,679 |
| Australian Equities | $289,263,251 |
| Cash | $86,310,700 |
| Short | $60,306,686 |
| Listed Property | $30,574,051 |
Top category outflows (by $) – April 2023
| Sub-Category | Inflow Value |
| International Equities | ($37,186,469) |
| Commodities | ($15,057,041) |
Comment: Fixed Income exposures lead the way in terms of flows with the category recording the highest level of net flows this month ($350m) and also in the year to date. Broad Australian equities products also continued to receive flows, as has been the case for the year more broadly.
Top sub-category inflows (by $) – April 2023
| Sub-category | Inflow Value |
| Australian Bonds | $233,280,033 |
| Australian Equities – Broad | $203,326,378 |
| Global Bonds | $116,279,190 |
| Cash | $86,310,700 |
| Australian Equities – – E&R – ESG Lite | $56,148,860 |
Top sub-category outflows (by $) – April 2023
| Sub-Category | Inflow Value |
| International Equities – Developed World | ($141,053,073) |
| International Equities – Sector | ($39,171,525) |
| Australian Equities – E&R – Ethical | ($36,445,813) |
| Australian Equities – Geared | ($22,147,067) |
| Gold | ($10,198,388) |
*Past performance is not an indicator of future performance.




2 comments on this
Hi, I’m interested in an Aust ETF that specialises in high dividend returns.
Regards, Roger Smith
Hi Roger,
Betashares offers a range of ETFs that aim to provide higher distributions. If you go to Funds > View all funds and then filter by “Equity income”, you’ll see our full range of equity income funds. Several of these invest in Australian equities.
Regards,
Patrick