

Hugh Lam
6 minutes reading time
2024 was a stellar year for some investors. Falling inflation and resilient economic growth propelled equity markets higher, but other asset classes such as gold and bitcoin performed even better.
However, the year wasn’t without its challenges with political quagmire developing across G7 nations, a brief yen carry trade unwind1 in early August, and continuation of Middle Eastern war efforts attempting to challenge the momentum of the equity freight train.
We recap how the charts submitted by members of the Betashares Investment Strategy & Research team, played out in 2024.
1 – Unemployment remains at cycle lows
Nominated by: David Bassanese, Chief Economist.
Chart 1: US Civilian unemployment rate, seasonally adjusted

Source: US Bureau of Labor Statistics, Betashares. As at 31 December 2024.
Why this was important: US unemployment effectively indicates whether the world’s largest economy is likely to go into or avoid a recession
What happened in 2024?: The US unemployment rate remains at cycle lows, rising only 0.4% to 4.1% in December.
2 – Equity market concentration remains high
Nominated by: Louis Crous, Chief Investment Officer.
Chart 2: Top 5 company weights in the S&P 500
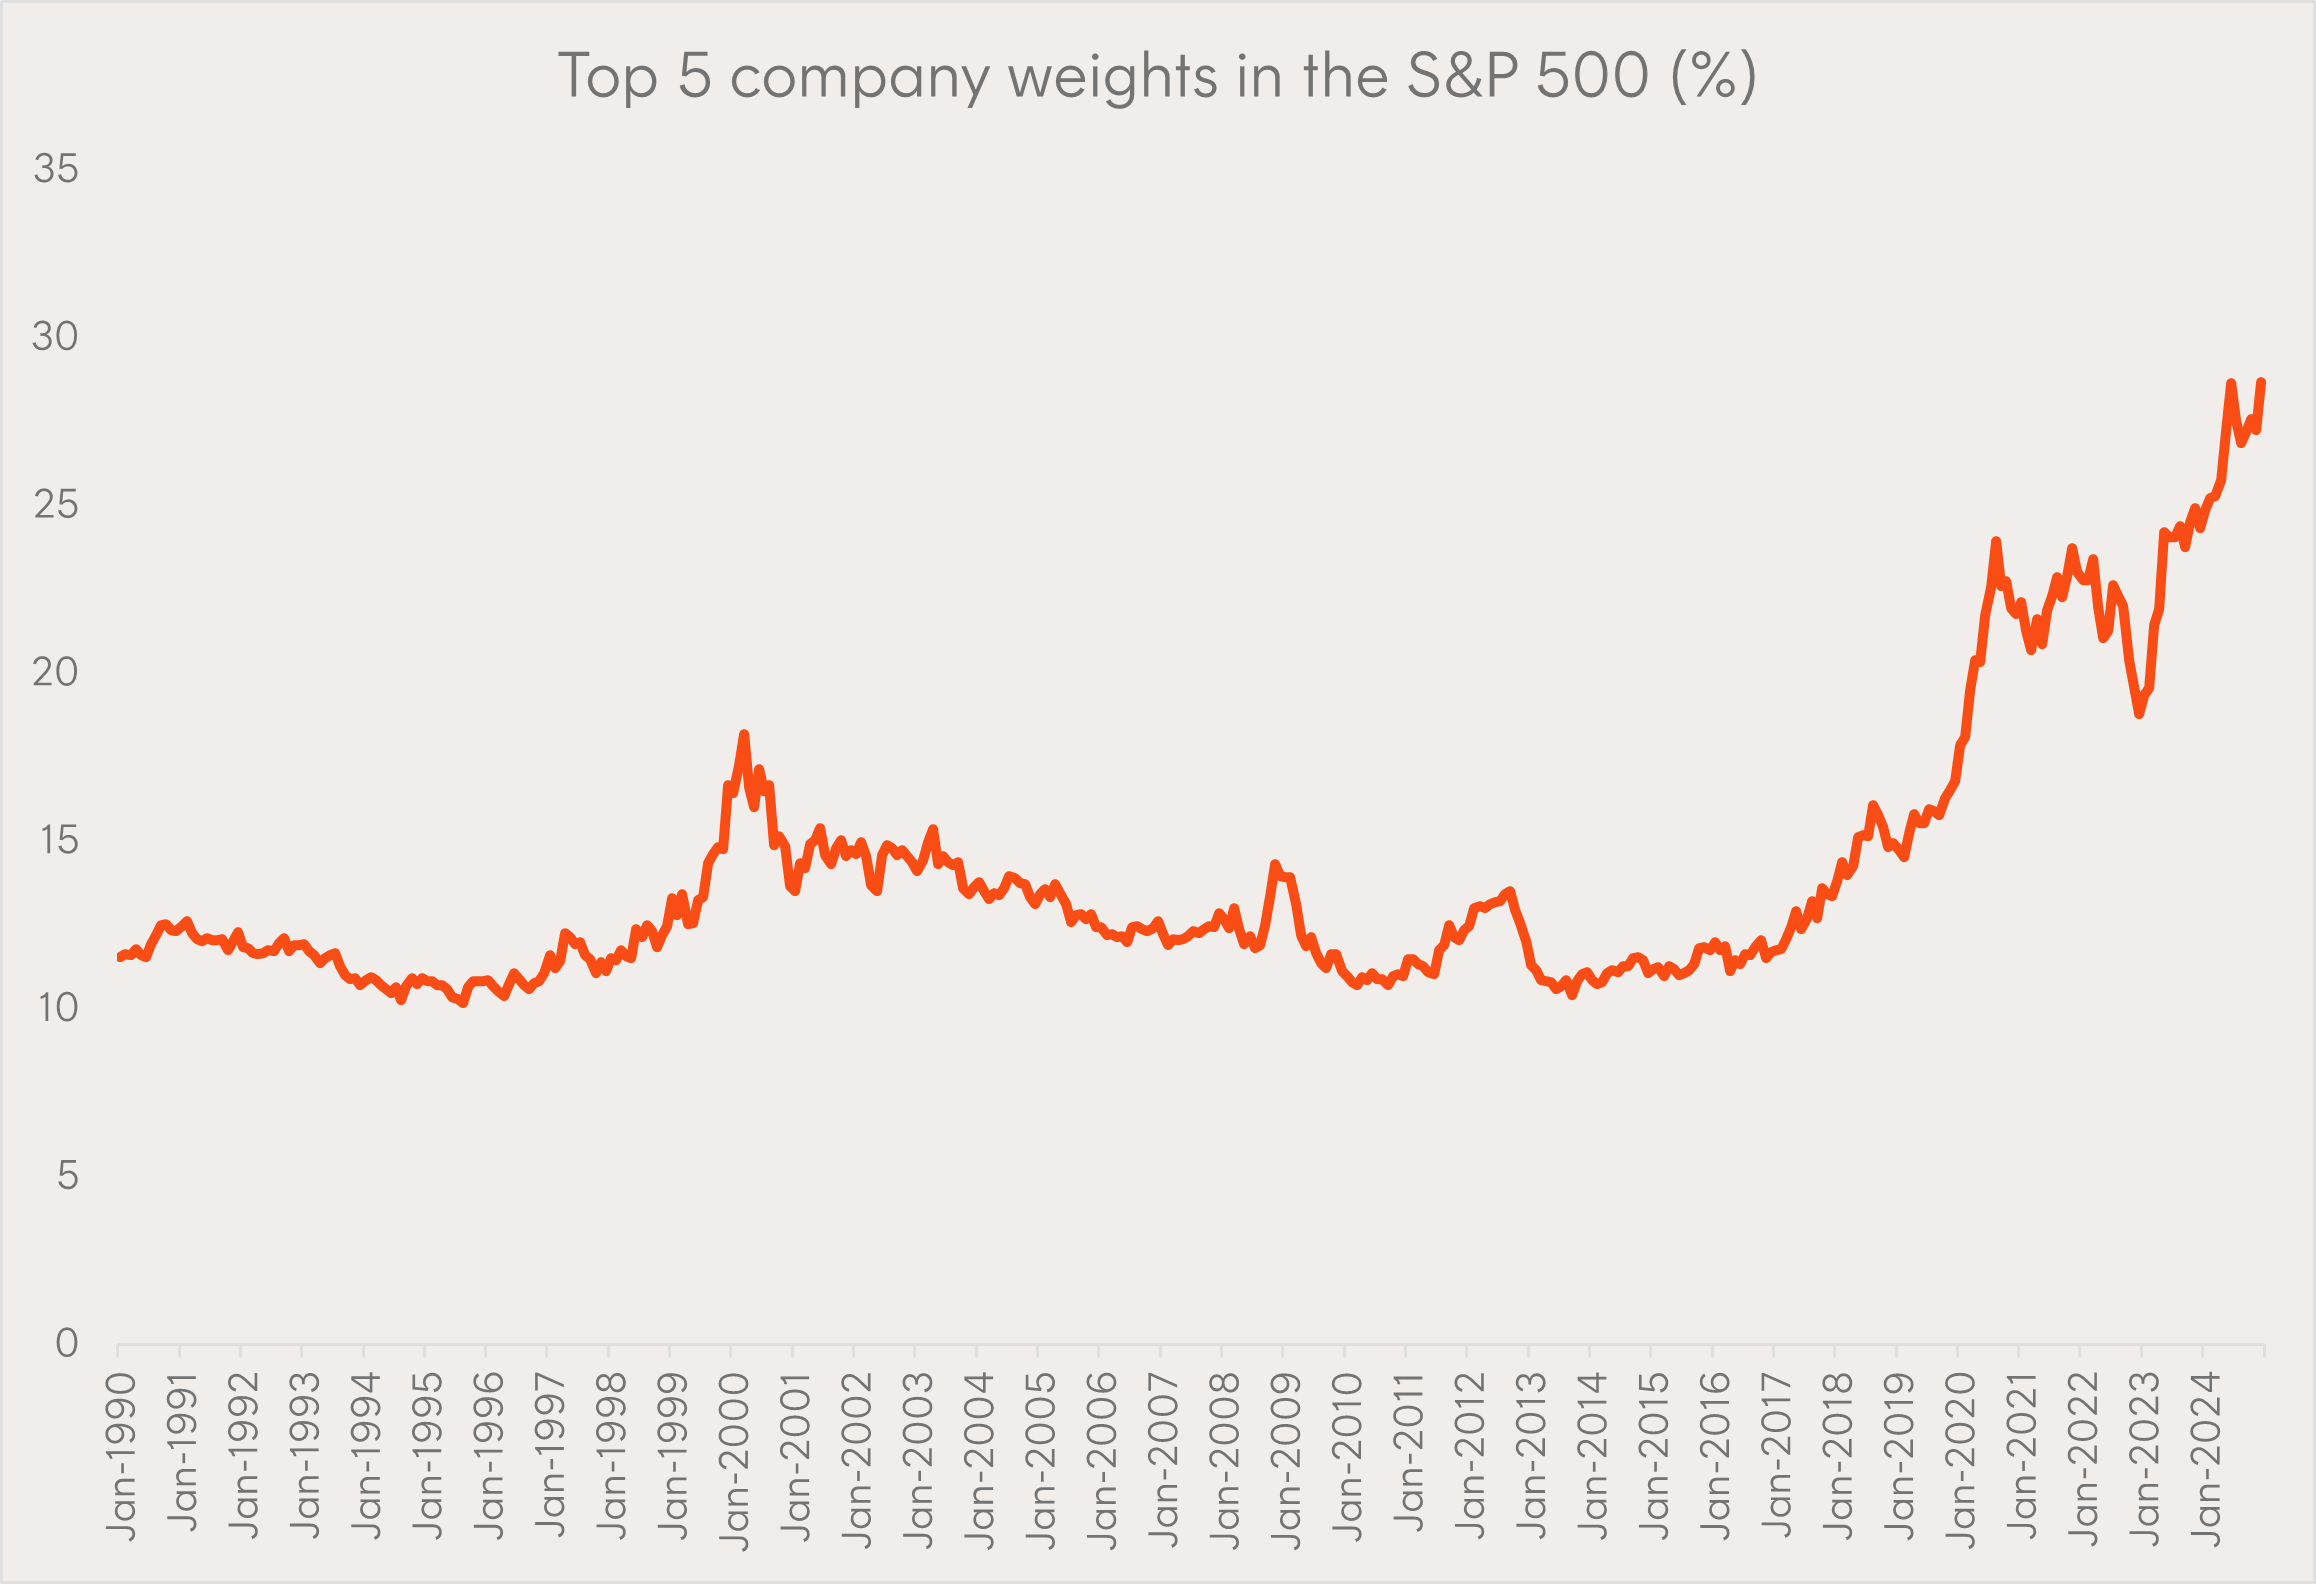
Source: Bloomberg, Betashares. As at 31 December 2024. Long-run average of the top 5 company weights in the S&P 500 being 14%
Why this was important: Historically, high equity market concentration has tended to increase the risk of an acute sell-off, particularly if a small group of stocks are within the same sector.
What happened in 2024?: Market concentration* in the US continued to rise higher in 2024, reaching 28.7% of the S&P 500 by year end. If market breadth improves and concentration in the S&P 500 recedes, some investors may wish to consider the Betashares S&P 500 Equal Weight ETF (ASX: QUS).
*As measured by the weight of the top five holdings in the index.
3 – Nvidia continues to dominate in 2024
Nominated by: Cameron Gleeson, Senior Investment Strategist.
Chart 3: Nvidia Data Centre Revenues, USD millions
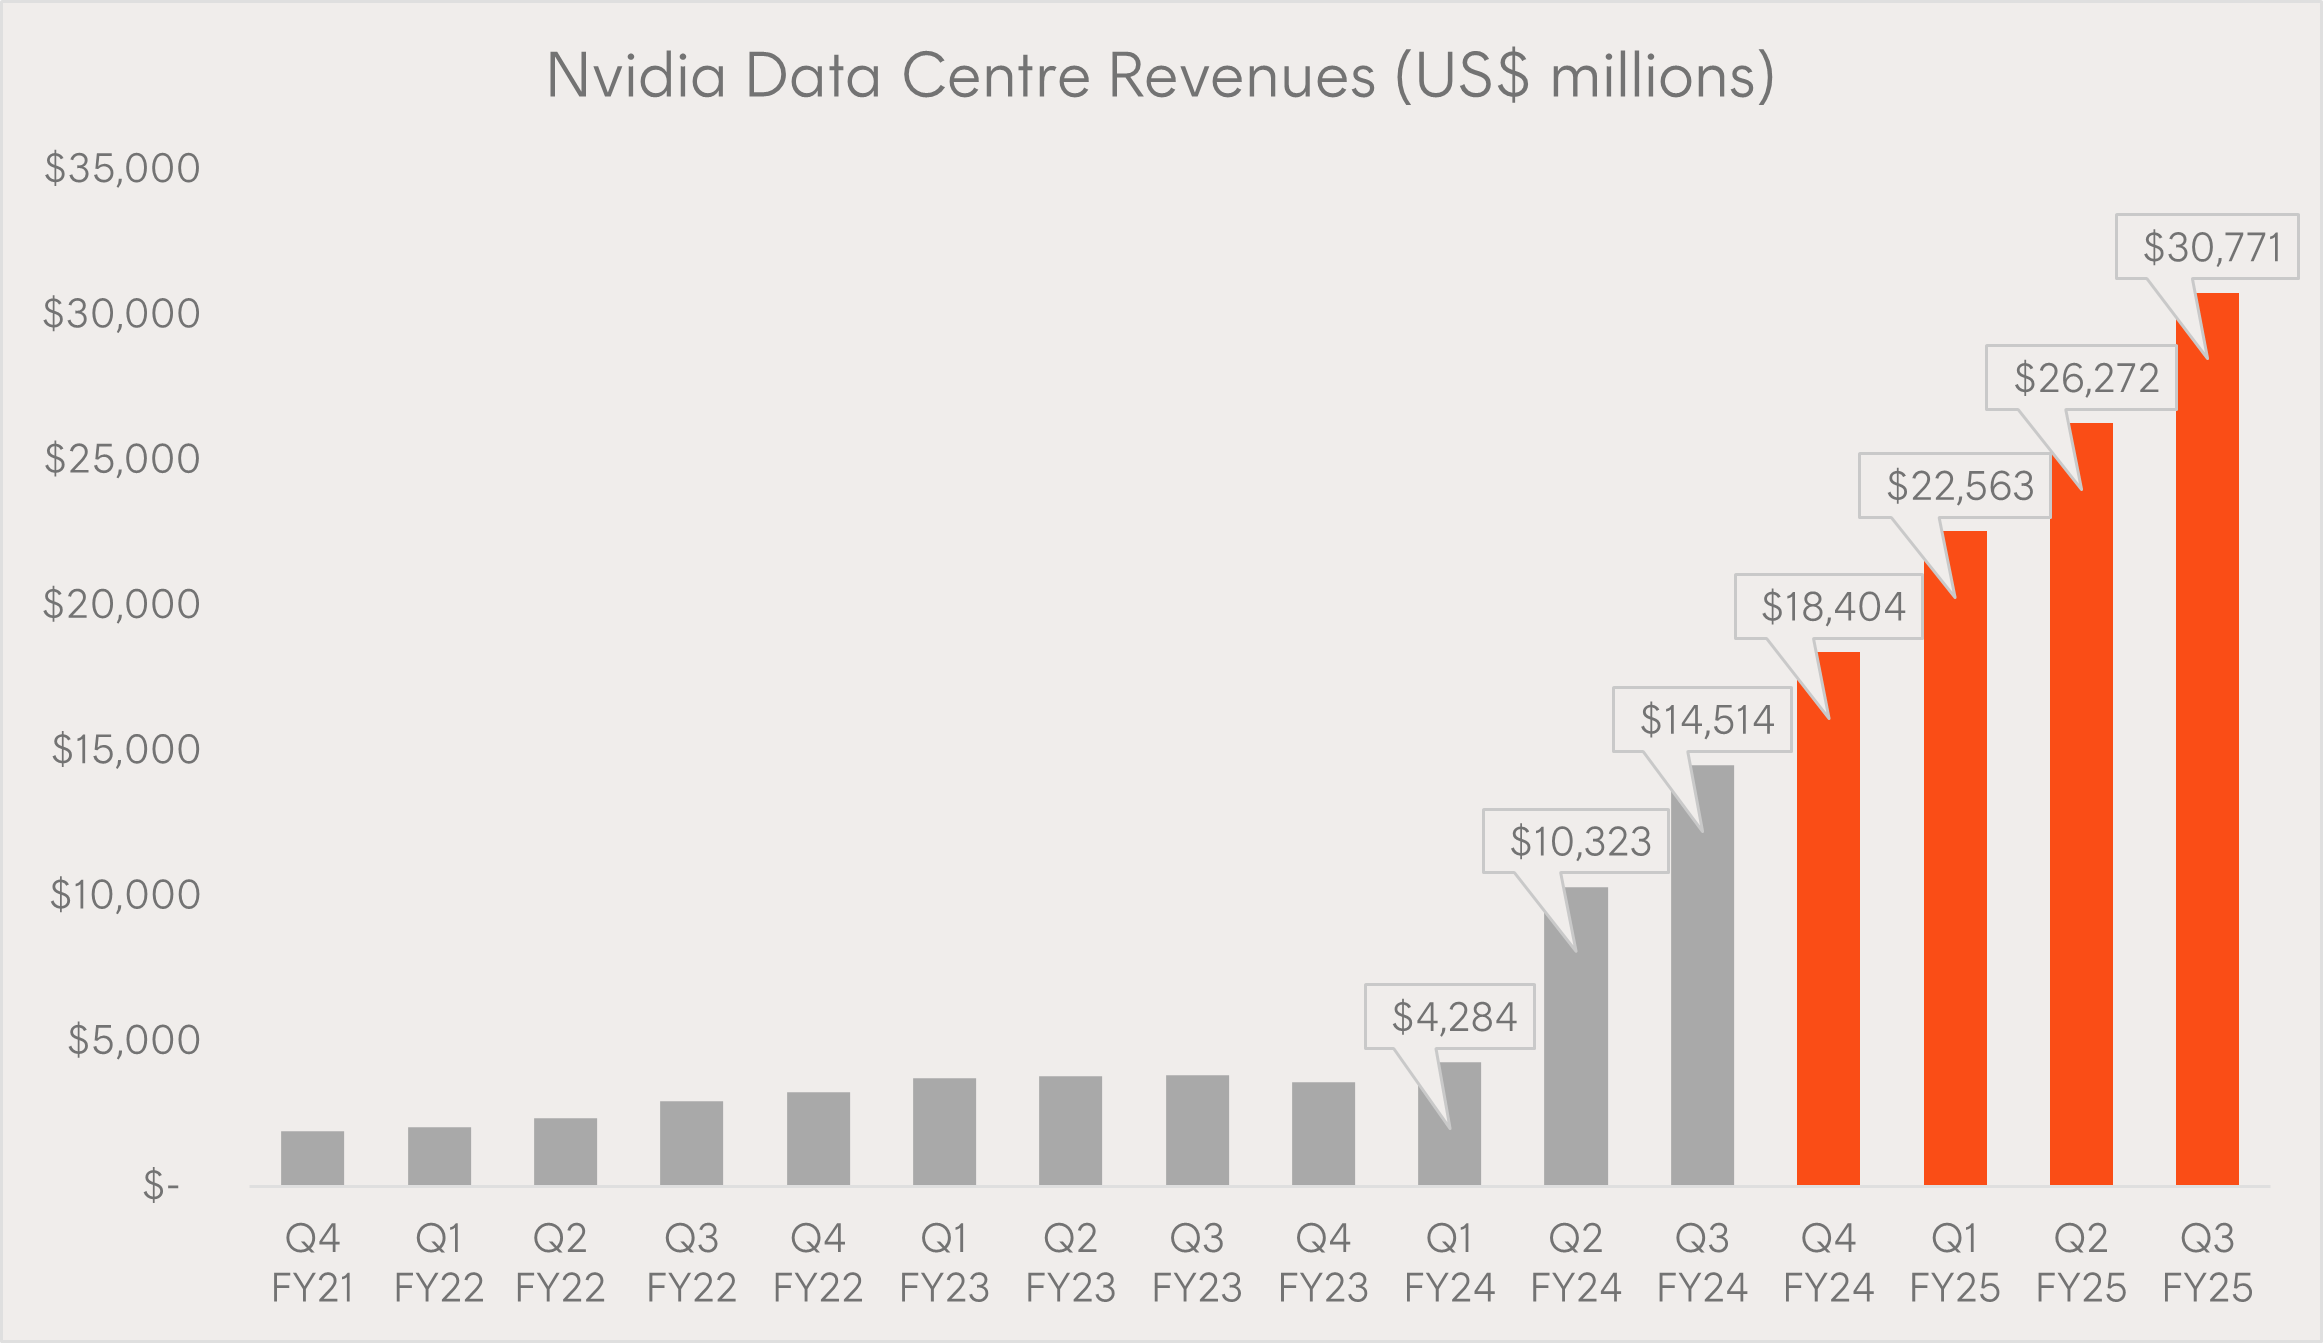
Source: Bloomberg, Betashares. As at 31 December 2024.
Why this was important: Nvidia has been a major contributor to US equity market returns over the last two years. The company alone contributed 5.4%2 to the entire S&P 500’s total return of 25% in 2024.
What happened in 2024?: Nvidia stock price rose by an incredible 171% in 2024, as revenues from its key data centre segment (which produces the advanced graphics processing units used to develop AI applications) grew exponentially to an annualised run rate of over US$120 billion.
4 – It’s payback time
Nominated by: Chamath De Silva, Head of Fixed Income.
Chart 4: US High Yield Corporate Debt Maturity Profile
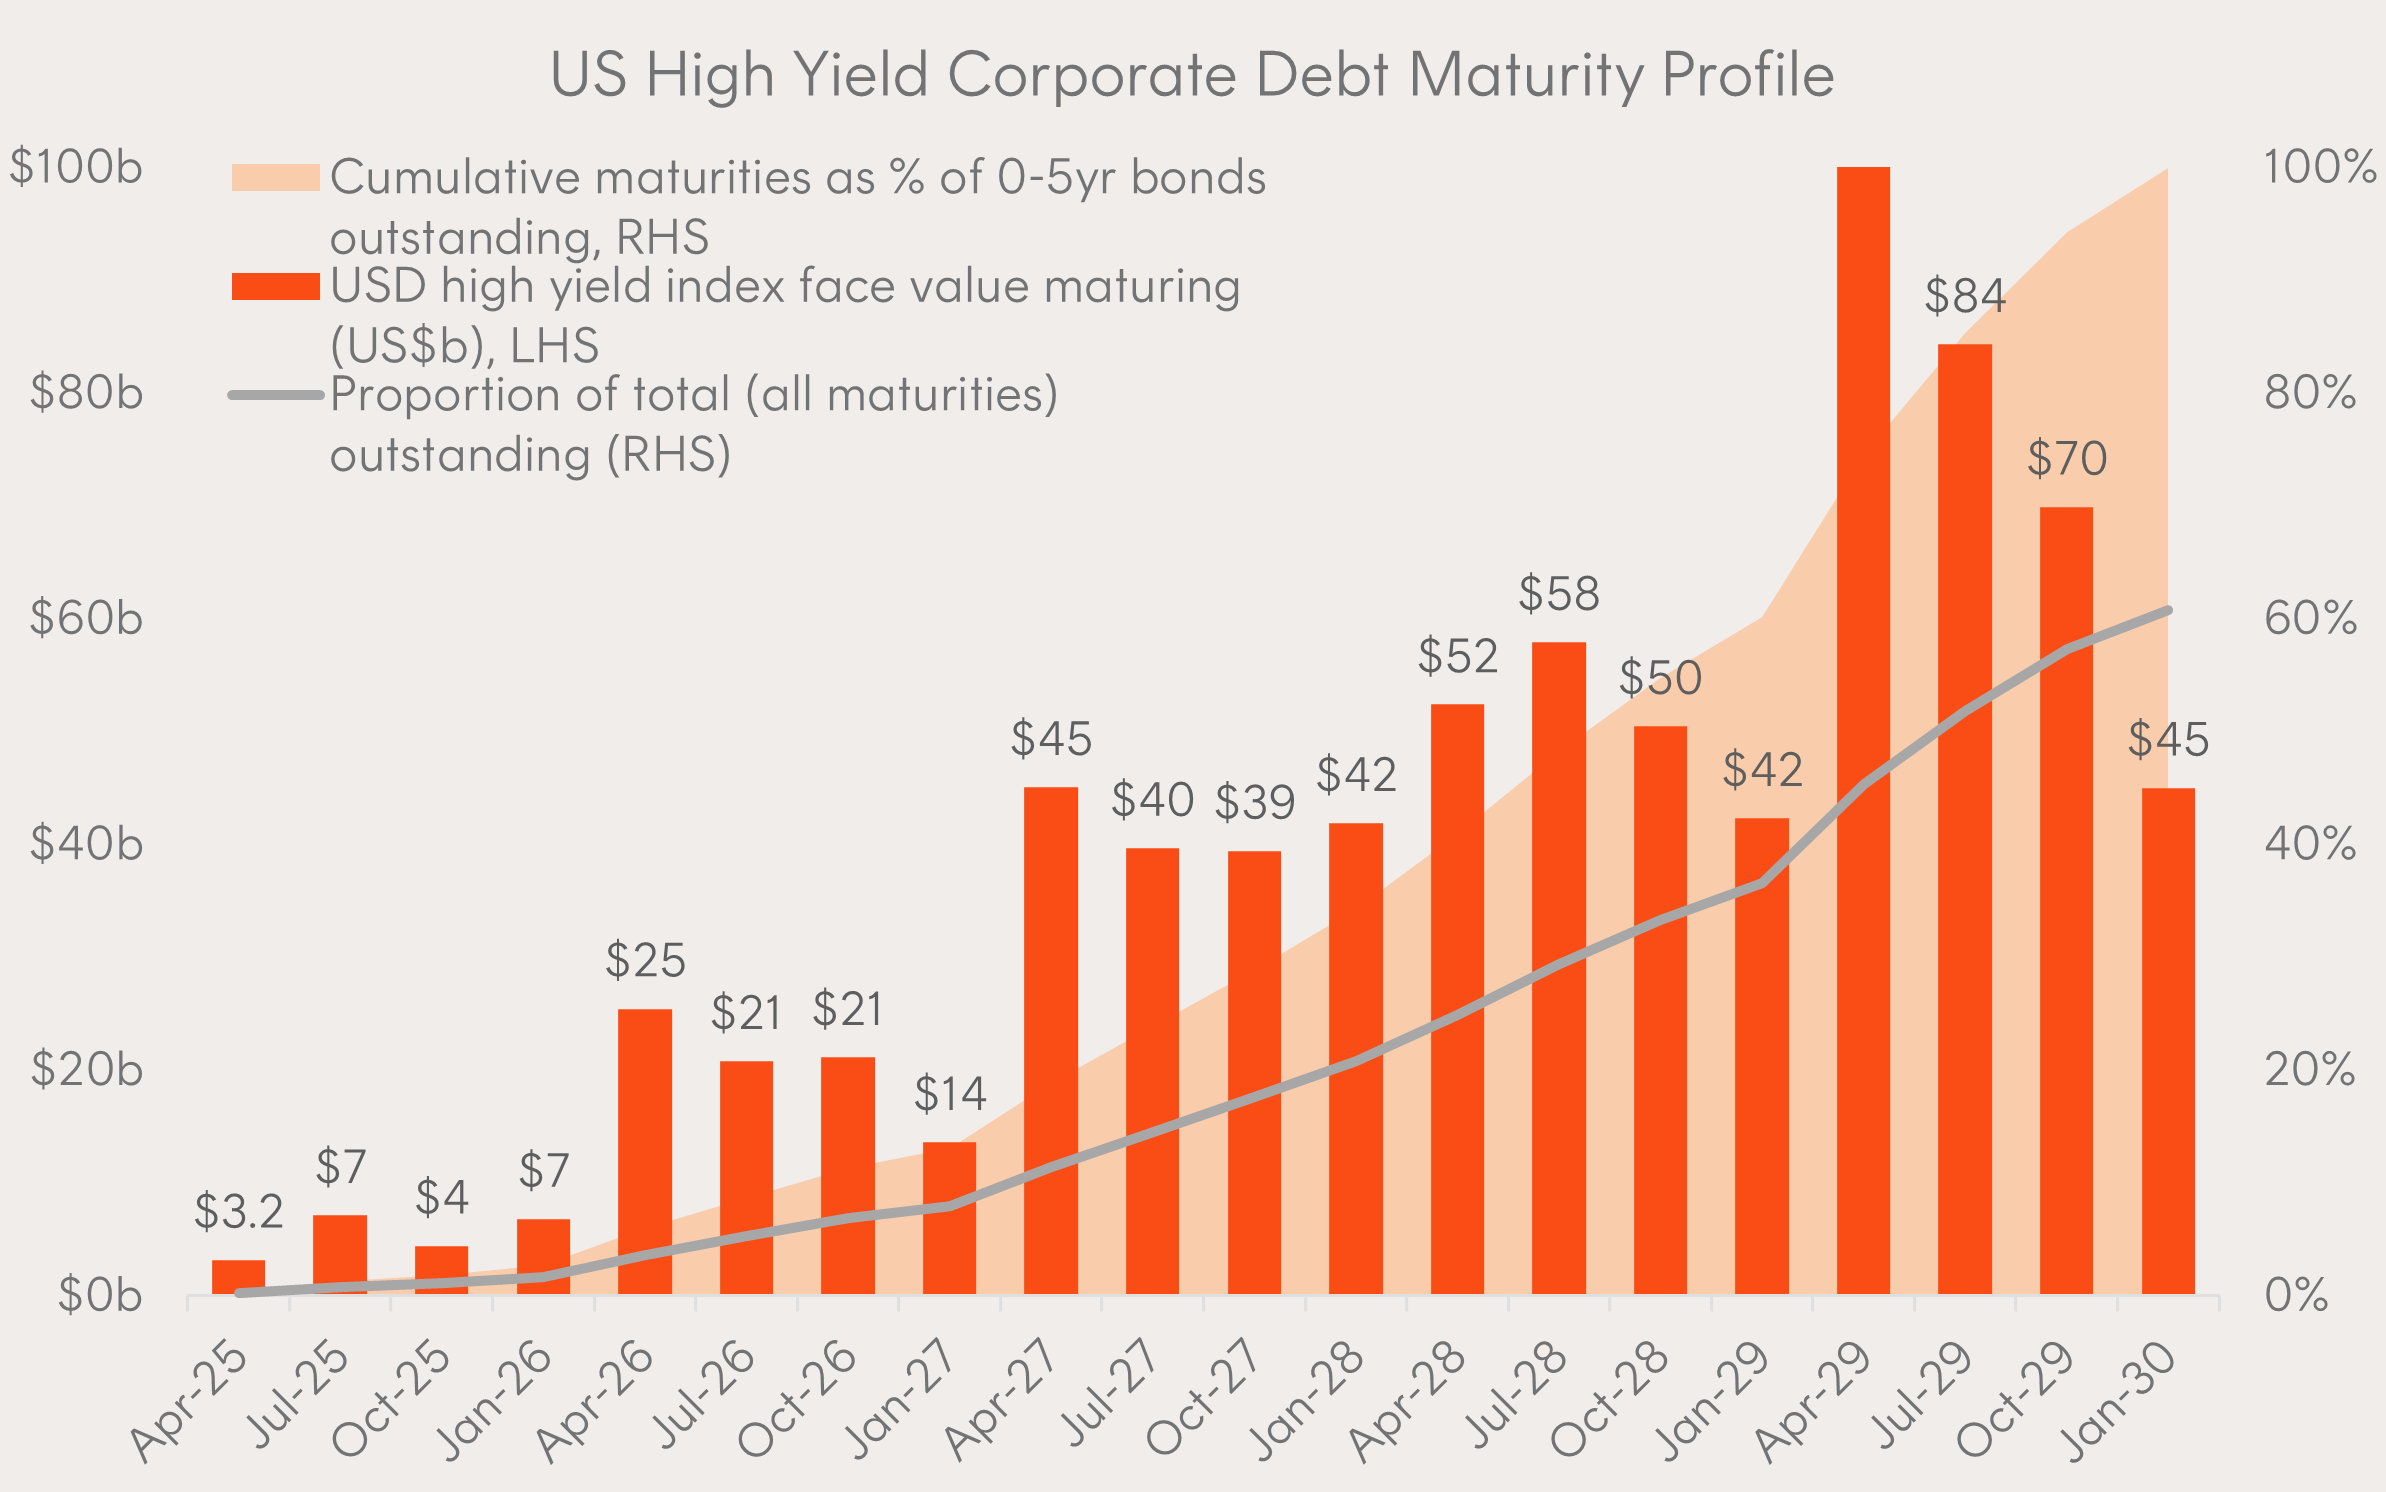
Source: Bloomberg, Betashares. As at 31 December 2024.
Why this was important: Between April 2020 and March 2022 – the two years that the US Federal Funds Rate sat at zero – corporations issued US$1.95 trillion in high yield debt. Much of this debt was issued with long maturities as issuers took advantage of low interest rates.
Corporates will need to decide whether to roll the debt over at new (higher) interest rates or pay it out in cash (assuming they can). If neither of these options are possible, defaults could rise.
What happened in 2024?: High-yield corporate bond spreads touched cyclical lows in 2024, touching 2.66%3 on November 29, 2024 as the US economy remained resilient. However, these corporates will still need to consider the rising proportion of their debts maturing over the next few years.
5 – Large caps outperform in 2024
Nominated by: Tom Wickenden, Investment Strategist.
Chart 5: Performance of US equity indices varying by size (rebased to 100)
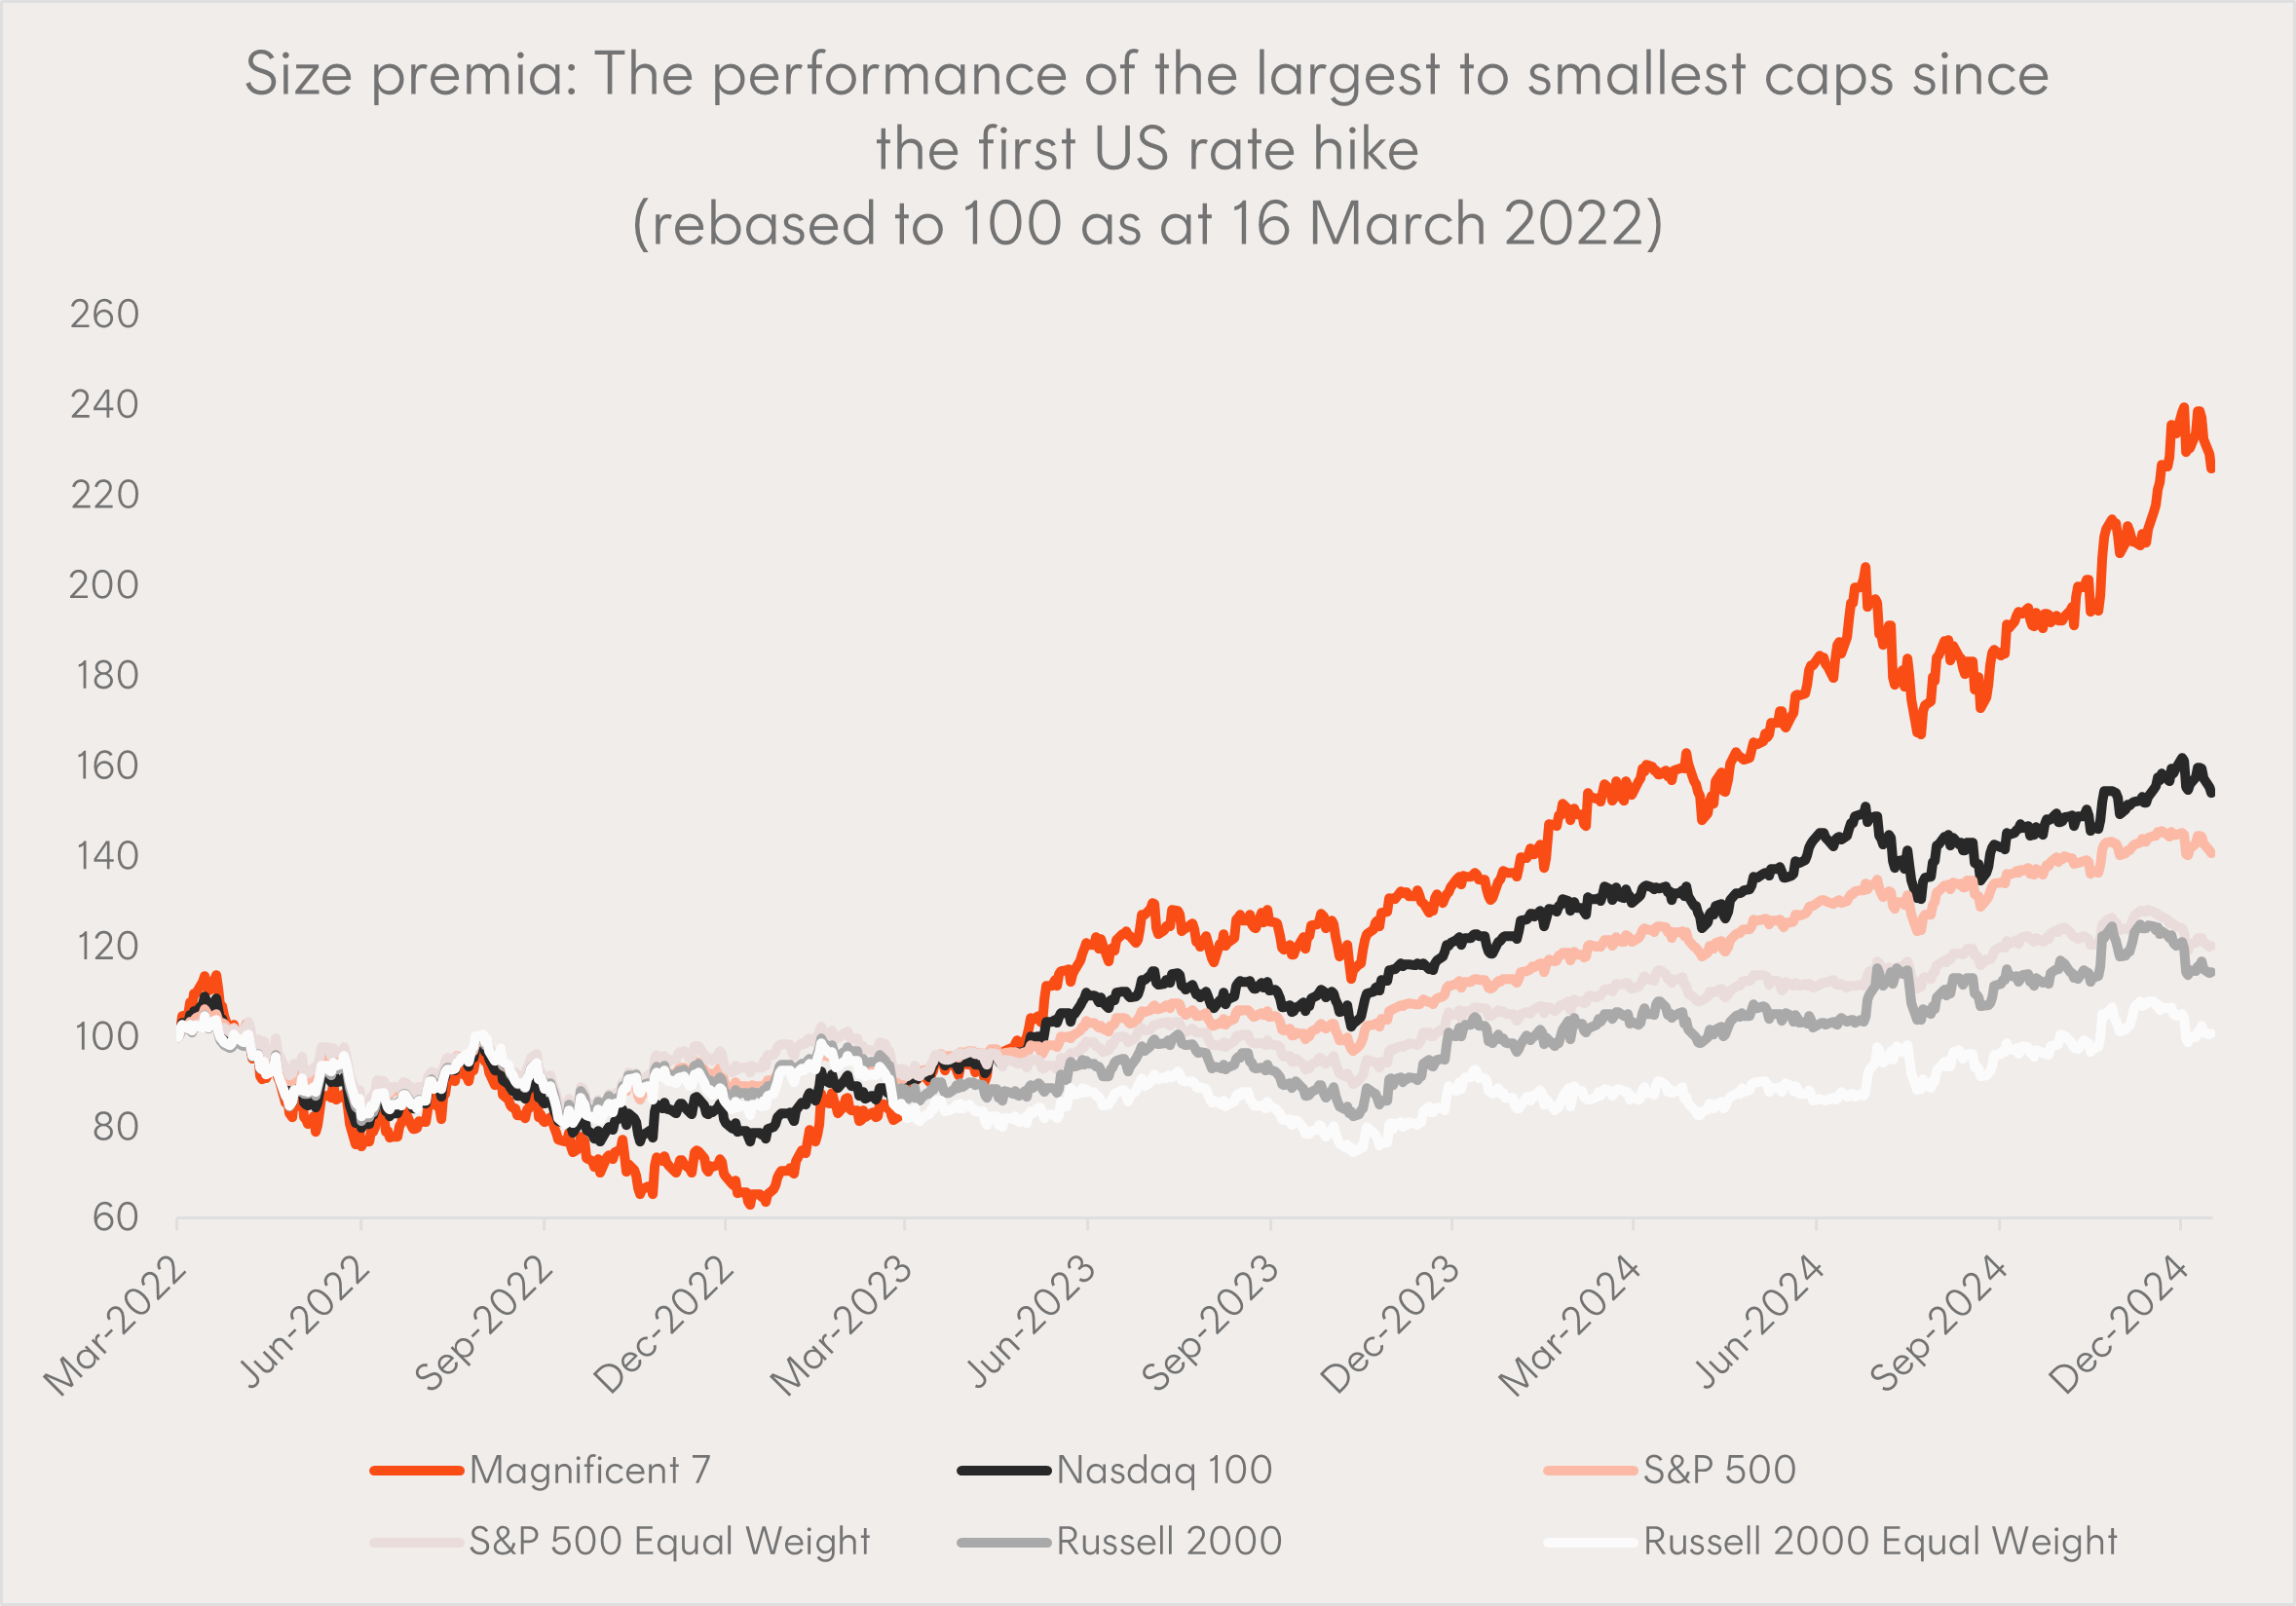
Source: Bloomberg, Betashares. As at 31 December 2024. Period from 16 March 2022 to 16 January 2025. Past performance is not indicative of future returns.
Why this was important: Large cap technology stocks endured the fastest rate hiking cycle in history throughout 2022. Whether this group of stocks could continue their run in 2024 remained in question.
What happened in 2024?: We saw further growth in the Magnificent 7* group of stocks as the AI thematic continued to play out. Whilst the S&P 500 Equal Weight Index returned 13% in 2024 as market breadth improved, the cap weighted S&P 500 and Nasdaq 100 indices outperformed the Equal Weight Index over the same period.
*Apple, Alphabet, Microsoft, Amazon, Meta Platforms, Tesla and Nvidia.
Investing involves risk. The value of an investment and income distributions can go down as well as up. An investment in each fund should only be considered as part of a broader portfolio, taking into account your particular circumstances, including your tolerance for risk. For more information on the risks and other features of each fund, please see the relevant Product Disclosure Statement and Target Market Determination, available at www.betashares.com.au.
Betashares Capital Limited (ACN 139 566 868 / AFS Licence 341181) (“BetaShares”) is the issuer of this information. This is general information only and we have not taken your individual circumstances, financial objectives or needs into account when preparing it. This information is not a recommendation to invest in any financial product or to adopt any particular investment strategy. Future results are inherently uncertain. This information may include opinions, views, estimates and other forward-looking statements which are, by their very nature, subject to various risks and uncertainties. Actual events or results may differ materially, positively or negatively, from those reflected or contemplated in such forward-looking statements. Opinions and other forward-looking statements are subject to change without notice. Any opinions expressed are not necessarily those of Betashares.
Sources:
1. Source: The market turbulence and carry trade unwind of August 2024 – Bank for International Settlements ↑
2. Source: Bloomberg ↑
3. Source: Charles Schwab ↑