Fed meeting recap: hawkish quarter point rate cut
4 minutes reading time
A wrap up of the charts catching our eye over the past month
US rate cuts begin, global healthcare a sector to watch, the future sector of China’s growth, and CBA analysts recommendations versus share price. See our picks for charts of the month in September.
1 – Let the cuts begin
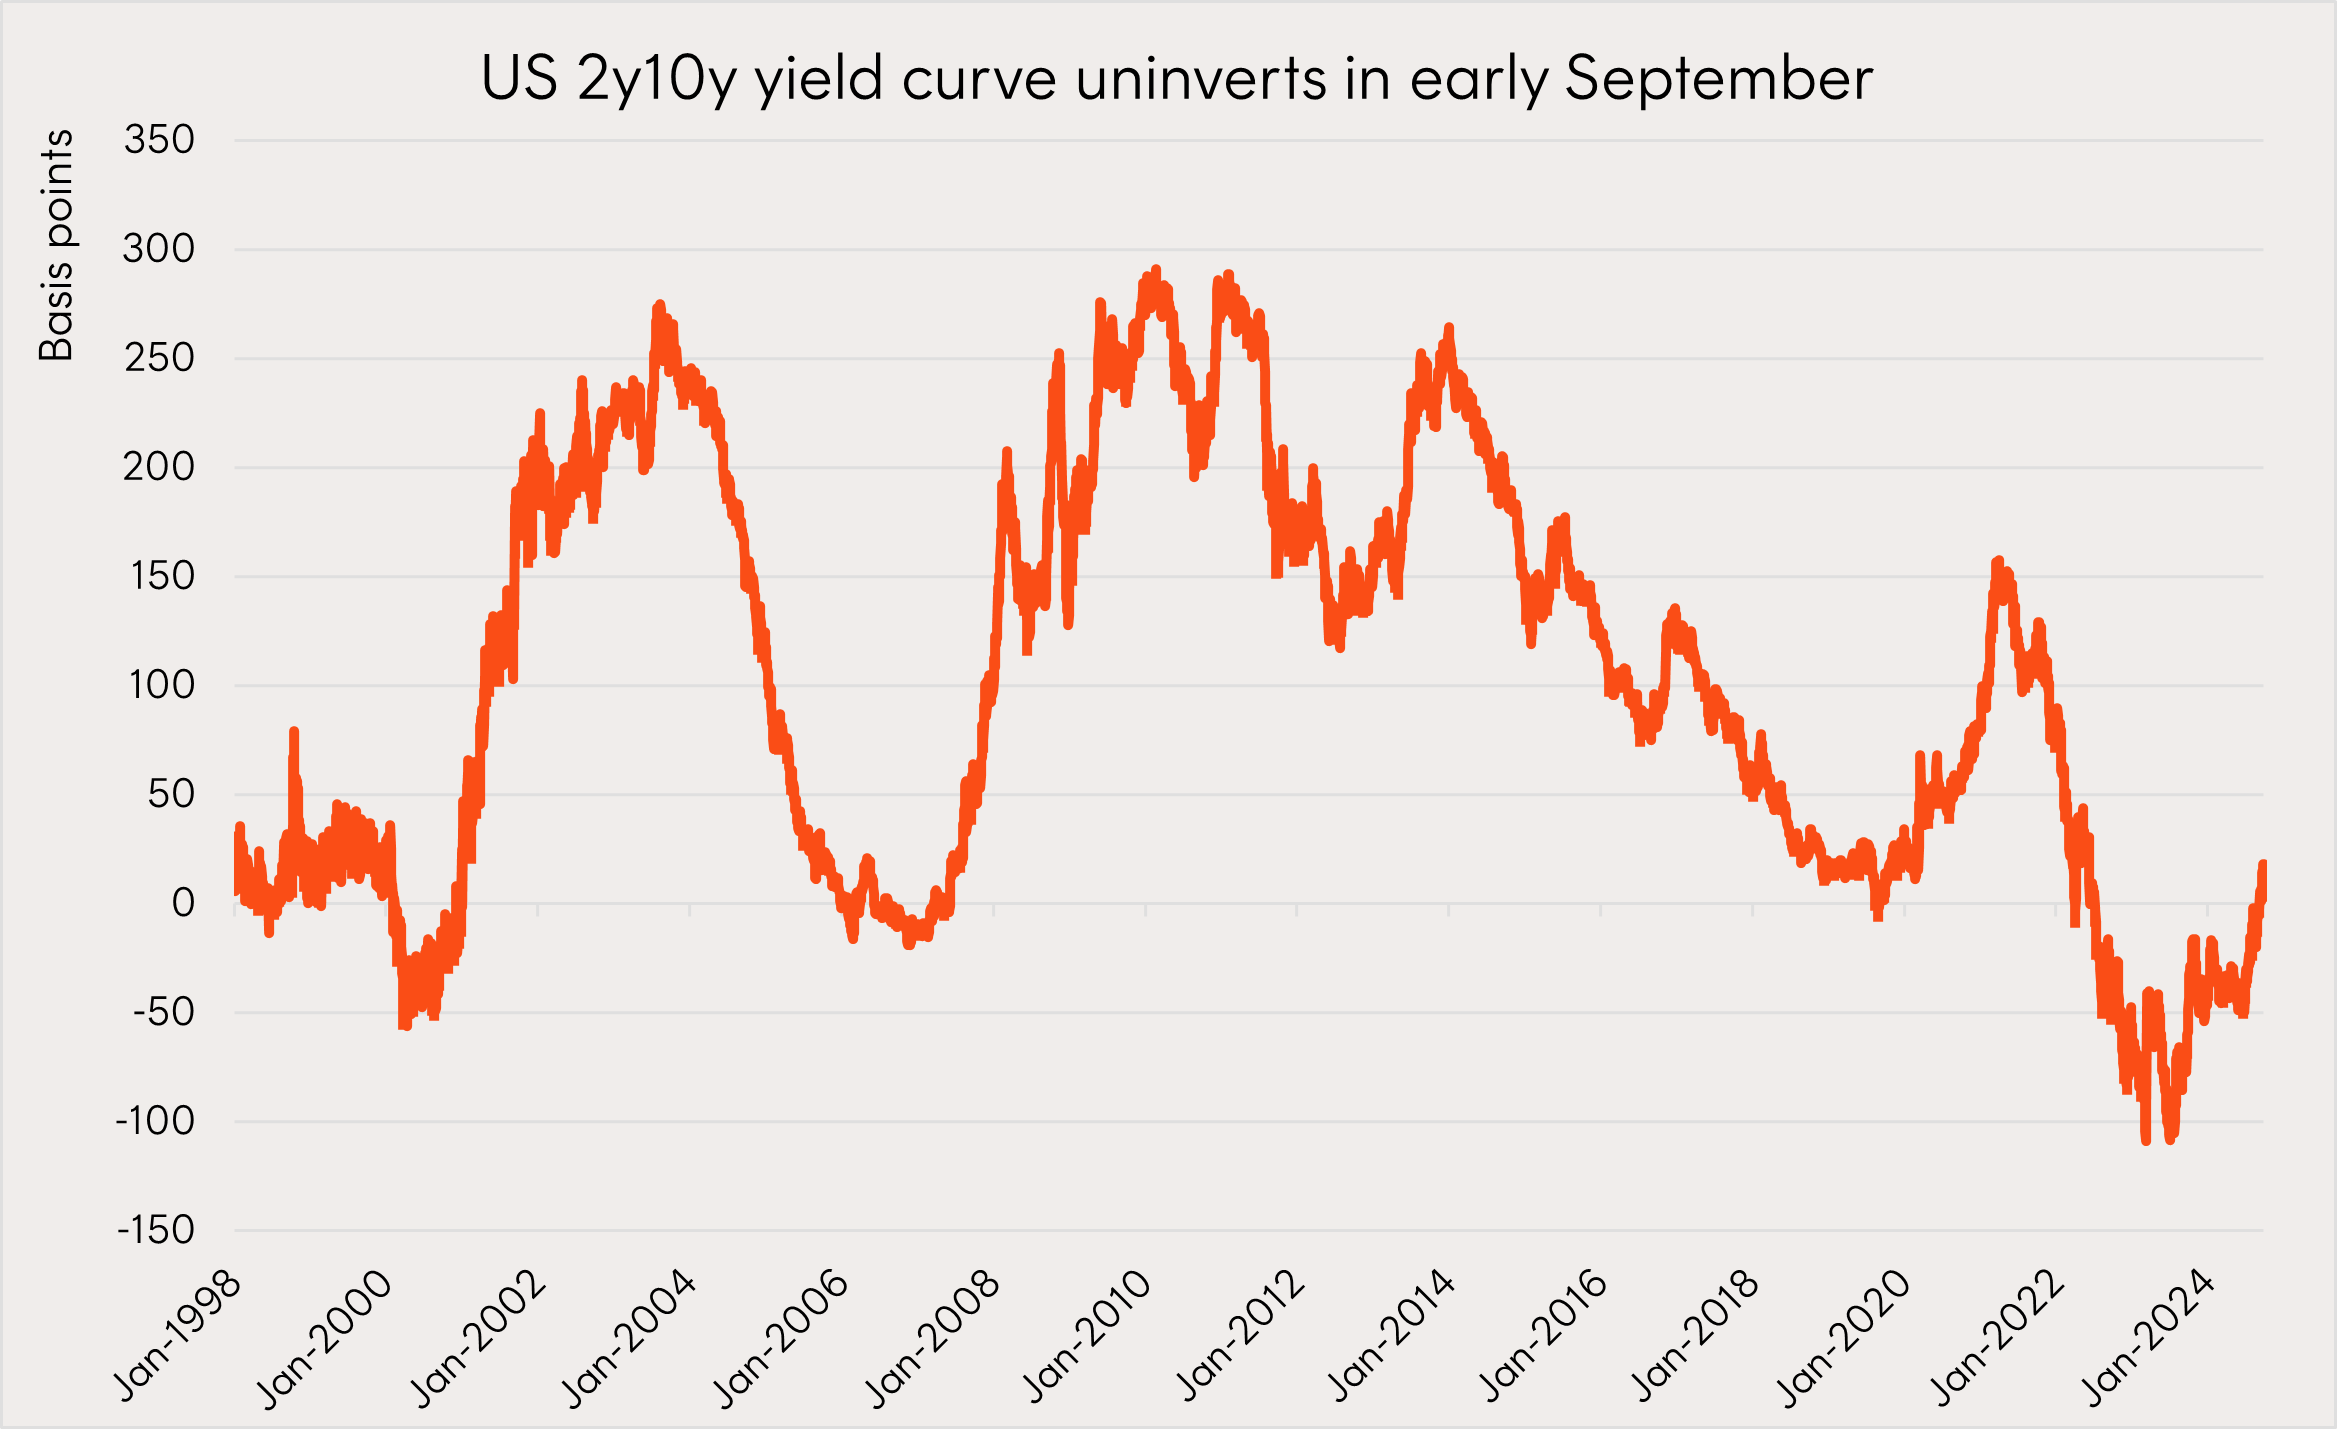
The US Federal Reserve cut interest rates by 50 basis points on September 18 – the first time in over four years.
Prior to this move, the yield curve was ‘inverted’ since July 2022 which had raised concerns of a potential recession in the US. However, the curve has since ‘uninverted’ earlier this month with interest rate cuts expected to continue into 2025. Whether this signal is indicative of a soft landing scenario will ultimately depend on the underlying health of the economy and if a recession can be avoided.
Chart 1: Difference between US 10-year yield and US 2-year yield from Jan 1998 to Sep 2024

Source: Bloomberg, Betashares as at 25 September 2024.
2 – Weighing up performance in a lower rate environment
Global healthcare has historically been one of the best relative performers during an interest rate easing cycle, given the sector’s ability to generate resilient revenue streams from inelastic demand and structural tailwinds from an ageing population. If monetary easing coincides with a recession again, healthcare may be a sound investment.
Chart 2: Global healthcare index cumulative relative total return vs MSCI World against Federal Funds Rate

Source: Bloomberg, Betashares. March 2001 to August 2024. Betashares Global Healthcare ETF Currency Hedged (ASX: DRUG) index is the Nasdaq Global ex-Australia Healthcare Hedged AUD Index. Past performance is not an indicator of future performance.
3 – Bullish Yen
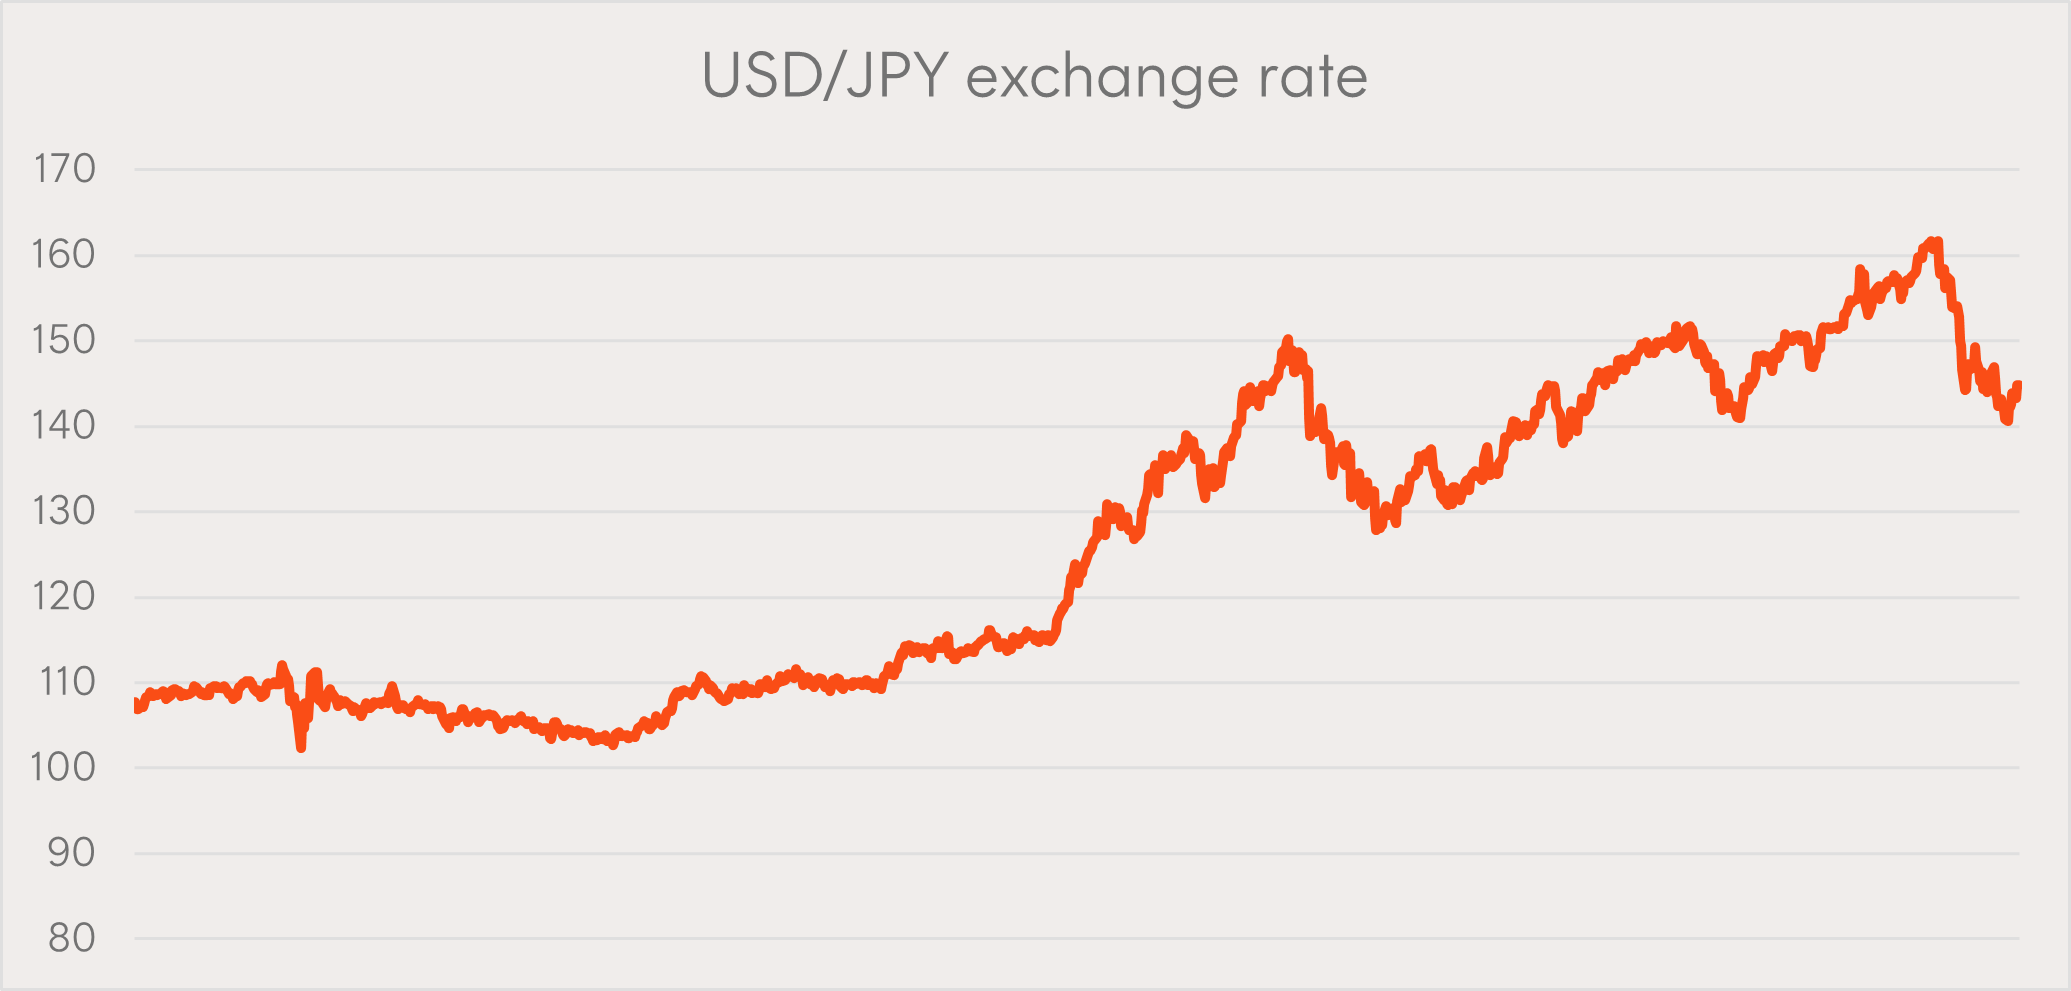
Investors are turning bullish on the Japanese Yen (JPY) with data from the Commodity Futures Trading Commission (CFTC) showing that funds held a net long position of 56,840 contracts, the biggest since early 2021.
The US dollar continues to weaken against the JPY over the past quarter with the interest rate cutting cycle under way by the US Federal Reserve, whilst the Bank of Japan has instead raised rates.
Chart 3: USD/JPY exchange rate and Japanese Yen net futures position


Source: Bloomberg, Betashares as at 26 September 2024. Past performance is not an indicator of future performance.
4 – Embracing the future
The high-tech sector (industries producing products such as electric vehicles, lithium-ion batteries and solar panels) is set to become a key structural contributor to China’s GDP as the government transitions away from a challenged real estate market.
Chart 4: Real Estate and High Tech percentage of China’s GDP

Source: Bloomberg, Betashares. As at 26 September 2024.
5 – Shying away from CBA
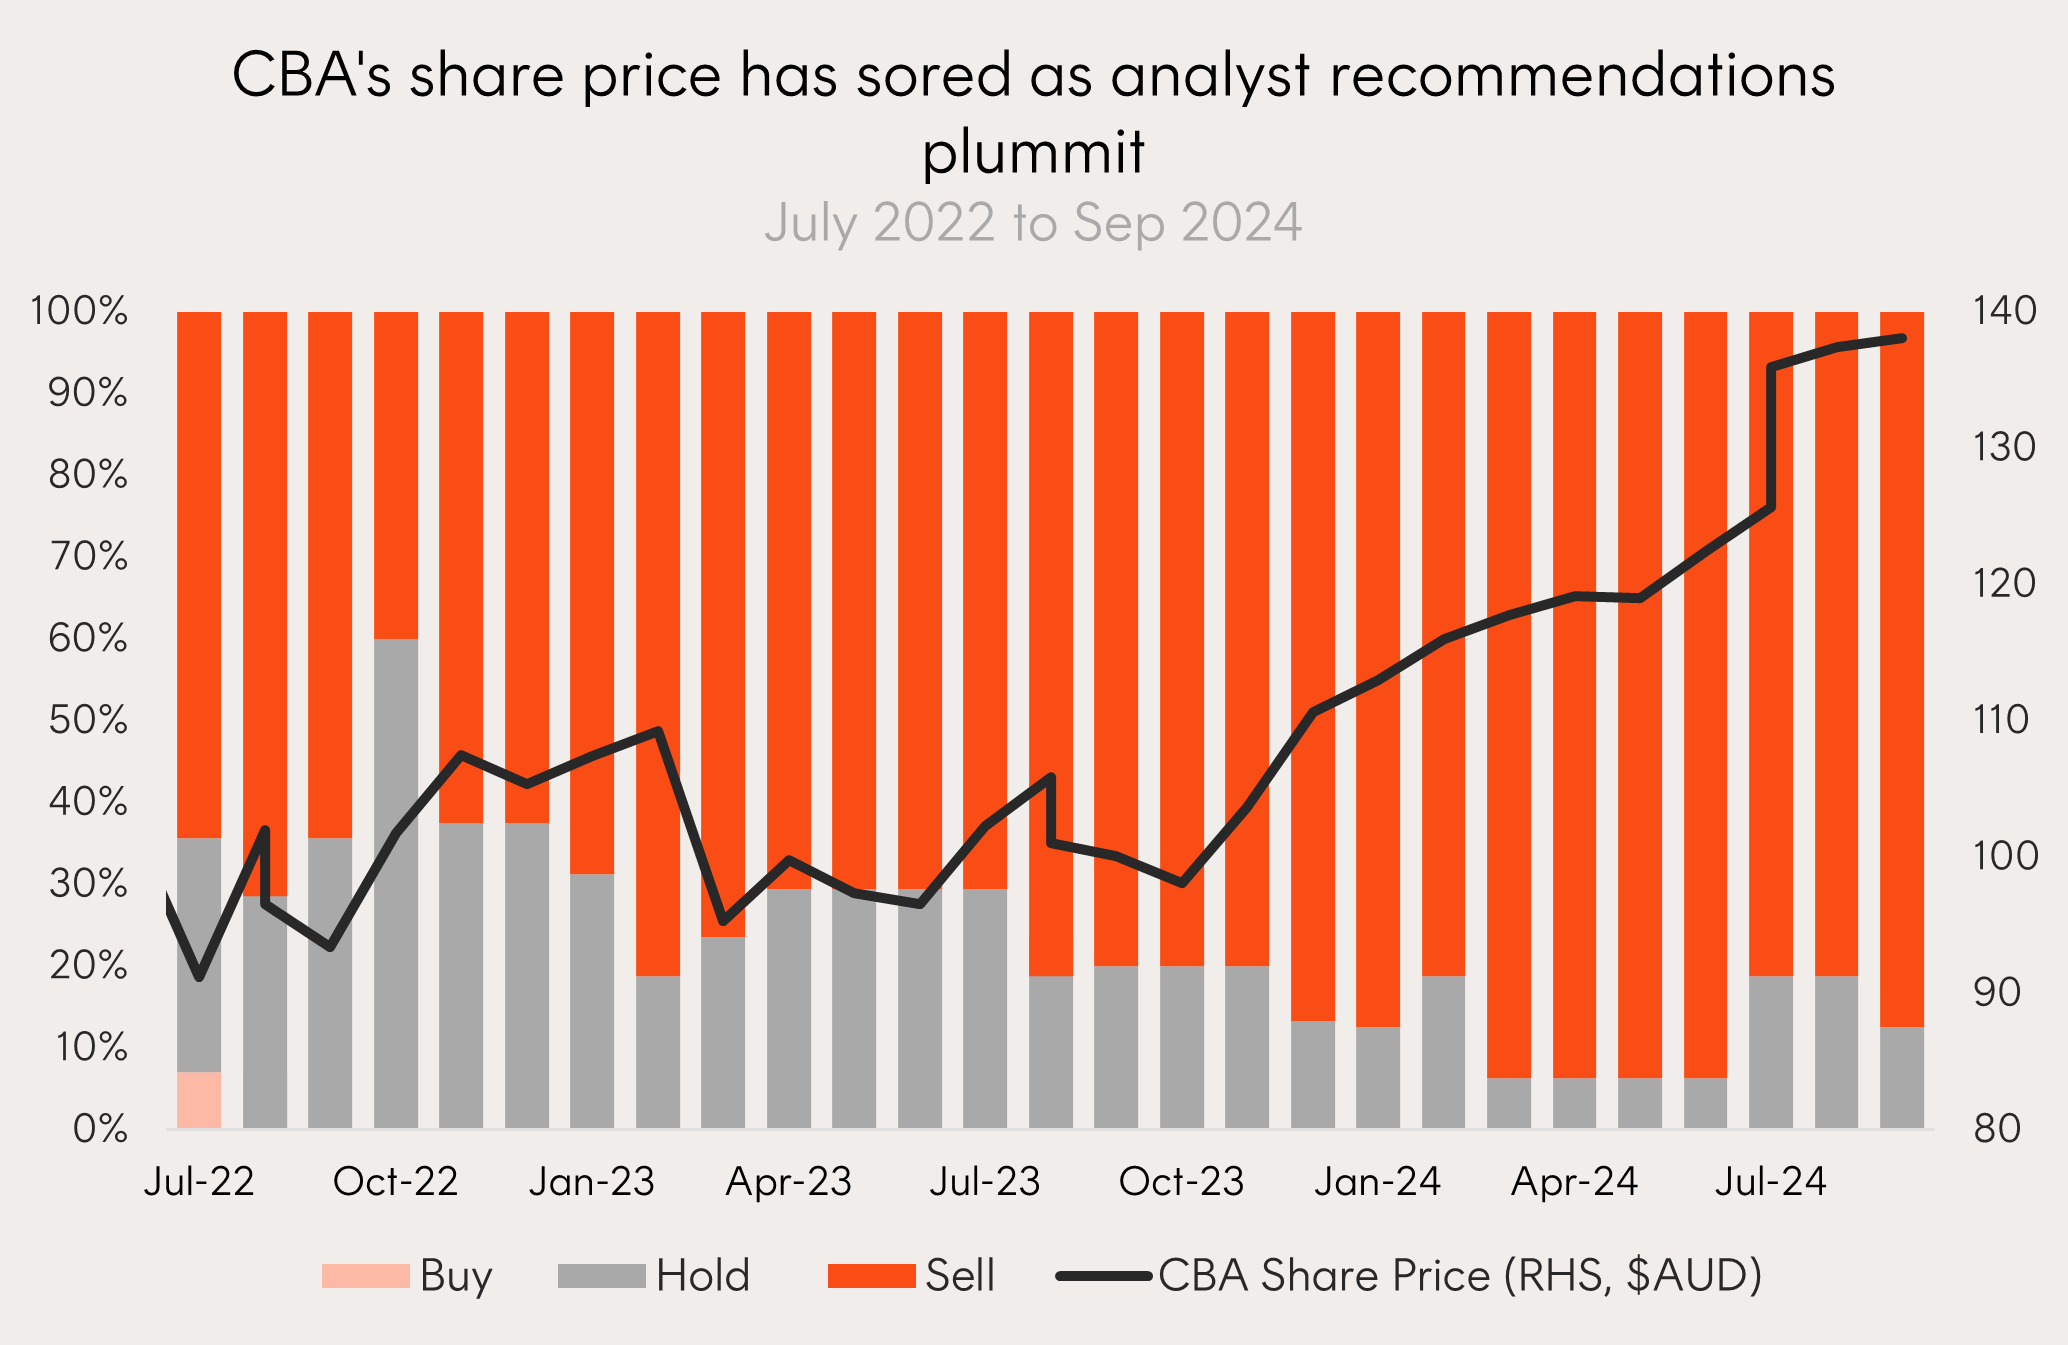
The share price of Australia’s largest bank has risen substantially over recent years, however conviction may be decreasing with the proportion of analysts with a ‘sell’ rating on the stock gradually increasing to around 90%.
Traditional equity benchmark indices, like the ASX 200, will allocate a higher weight to companies like CBA as their market capitalisation or size increases.
Smart beta strategies like QOZ FTSE RAFI Australia 200 ETF looks beyond this single metric and considers a company’s fundamentals like sales, dividends, cash flows and book value.
The result is an approach that benefits from a “buy low sell high” rebalancing philosophy as stocks that have moved in a manner that is not reflective of underlying fundamentals (like CBA) are generally sold or underweighted.
Chart 5: Proportion of buy, hold and sell analyst recommendations on ASX: CBA (LHS), CBA share price (RHS)

Source: Betashares, Bloomberg. As at 30 September 2024.
That’s all for now, but we’ll be back next month with more interesting insights as geopolitical tensions rise and the US election becomes a focal point for markets.


