Fed meeting recap: hawkish quarter point rate cut
4 minutes reading time
A wrap up of the charts catching our eye over the past month.
Markets reached an inflection point in May with equity indices and bond yields at cyclical highs. Whilst a strong reporting season from US large cap tech giants and falling inflation provided support for the US, stickier inflation in Australia left the local share market relatively flat.
1 – US corporates not feeling the pinch?
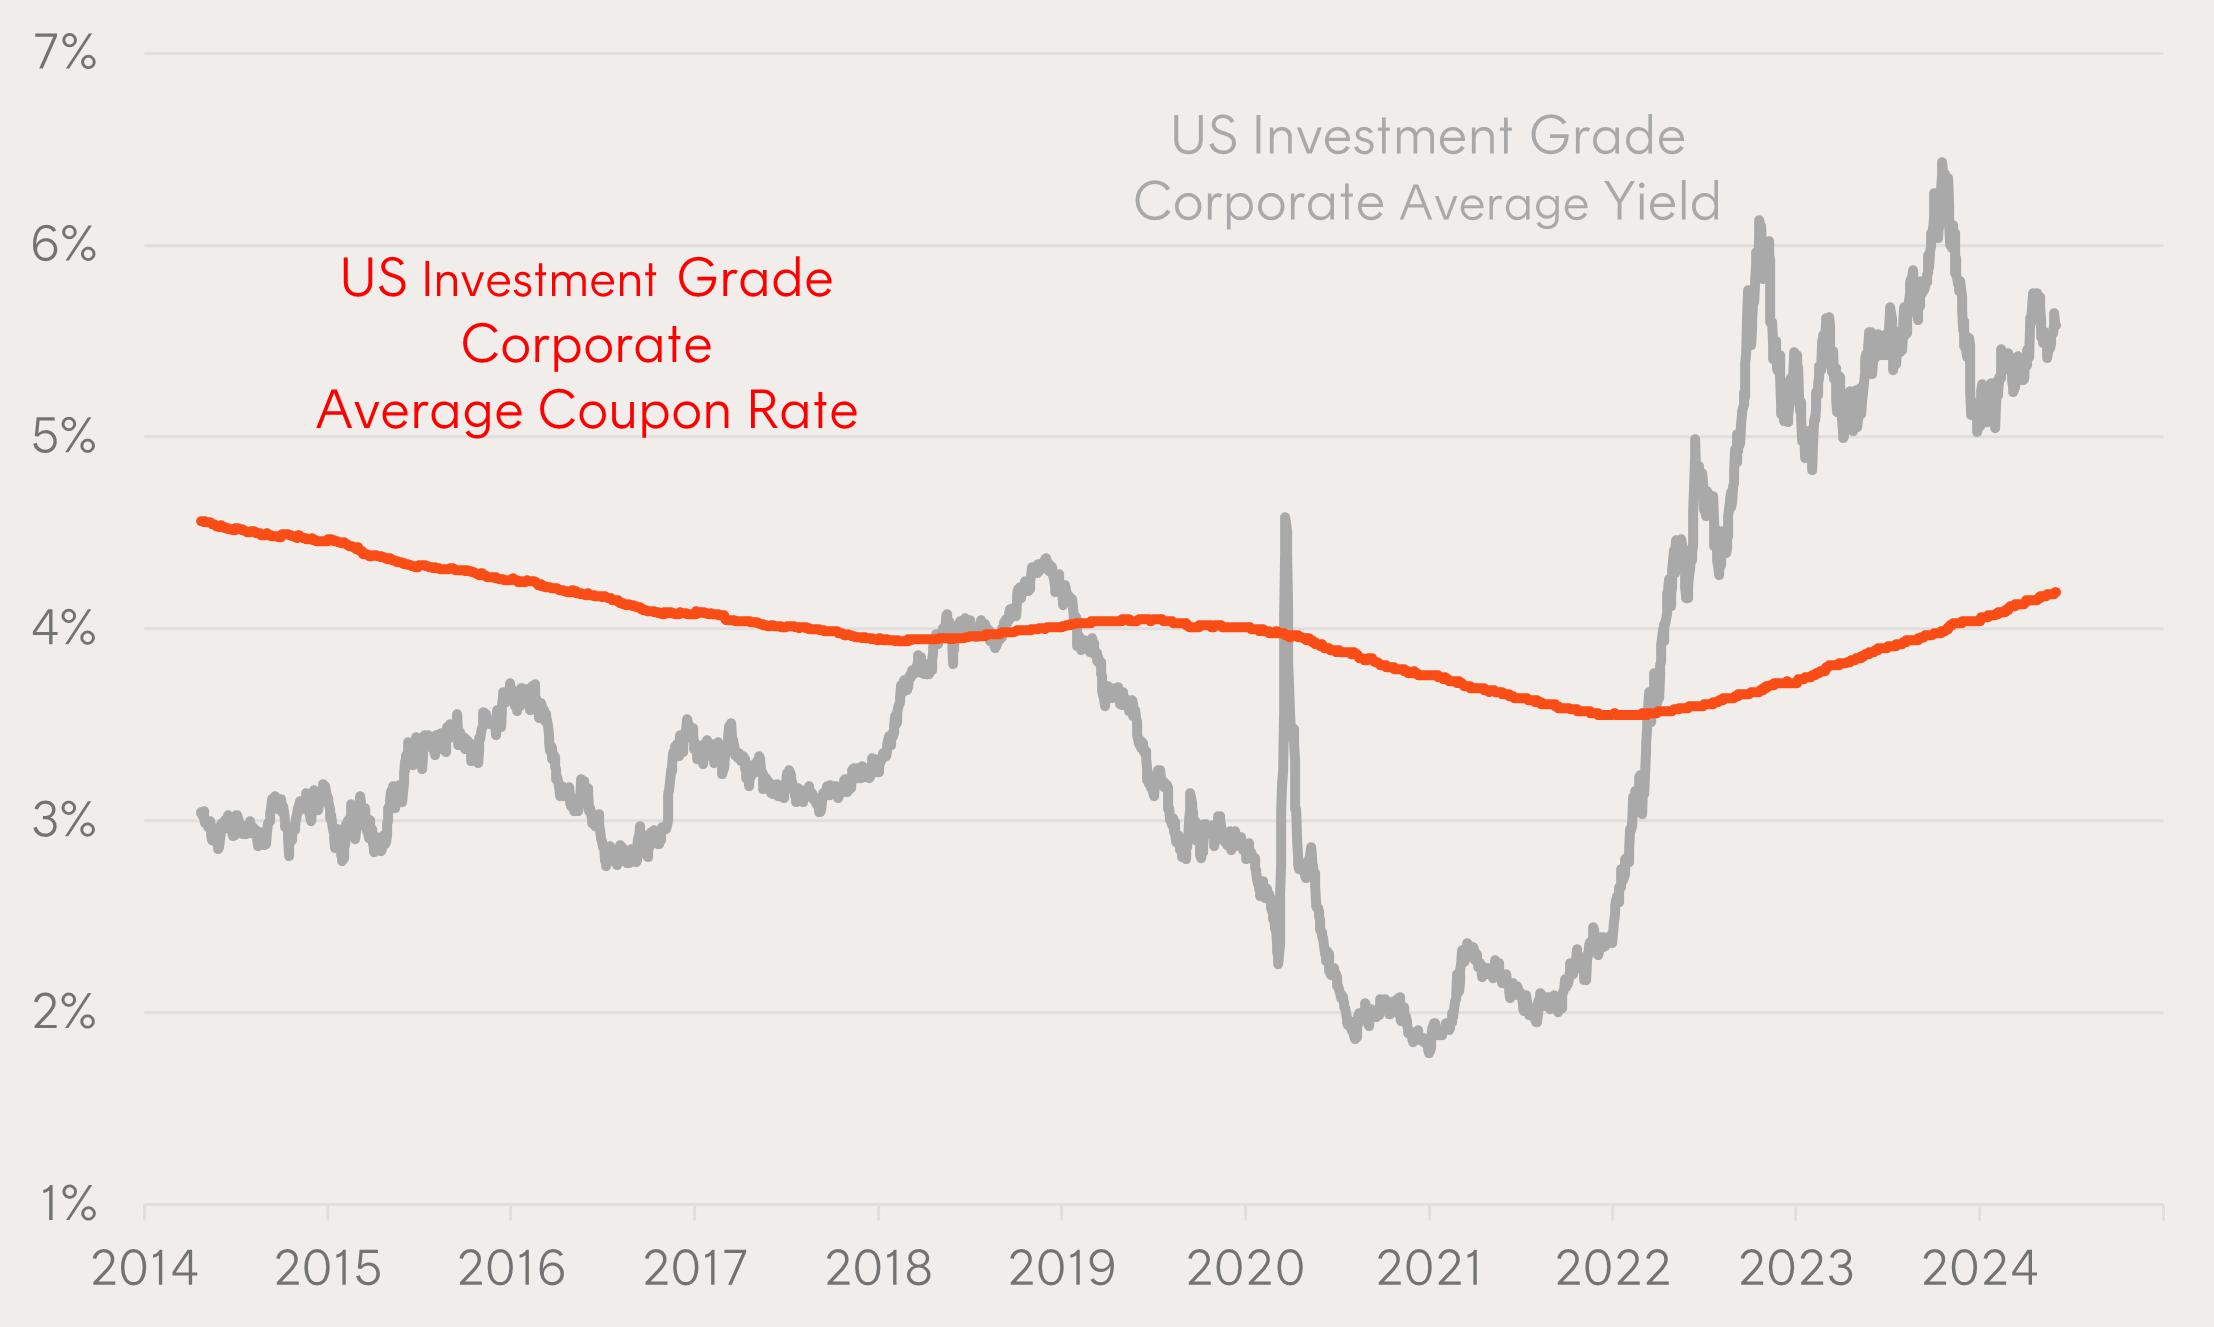
Despite corporate yields rising more than 4% since the Federal Reserve began its hiking cycle, corporate borrowing costs have not risen by the same degree.
The average coupon rate on US Investment Grade corporate bonds has only risen by around 0.65% during this period due to much of the term debt issued during Covid yet to be refinanced at higher rates.
As a result, balance sheets and earnings from US corporates remain strong.
Chart 1: US corporate bond yields vs average coupon rates
Source: Bloomberg, Betashares as at 31 May 2024.
2 – Inflation genie still out of the bottle
The annual trimmed mean inflation rate in Australia appears to be stickier than expected, rising to 4.1% from 4.0% a month prior.
Stalling disinflation increases the risk of interest rates remaining higher for longer, which would be expected to put greater pressure on individual and corporate balance sheets, slowing down the economy through less spending and investment.
After the upside surprise, market participants have pushed out the timing of an interest rate cut by the Reserve Bank of Australia to December 2025.
Chart 2: Australian annual trimmed mean inflation (% change)

Source: Australian Bureau of Statistics; as at 31 May 2024.
3 – Year of the Australian banks?
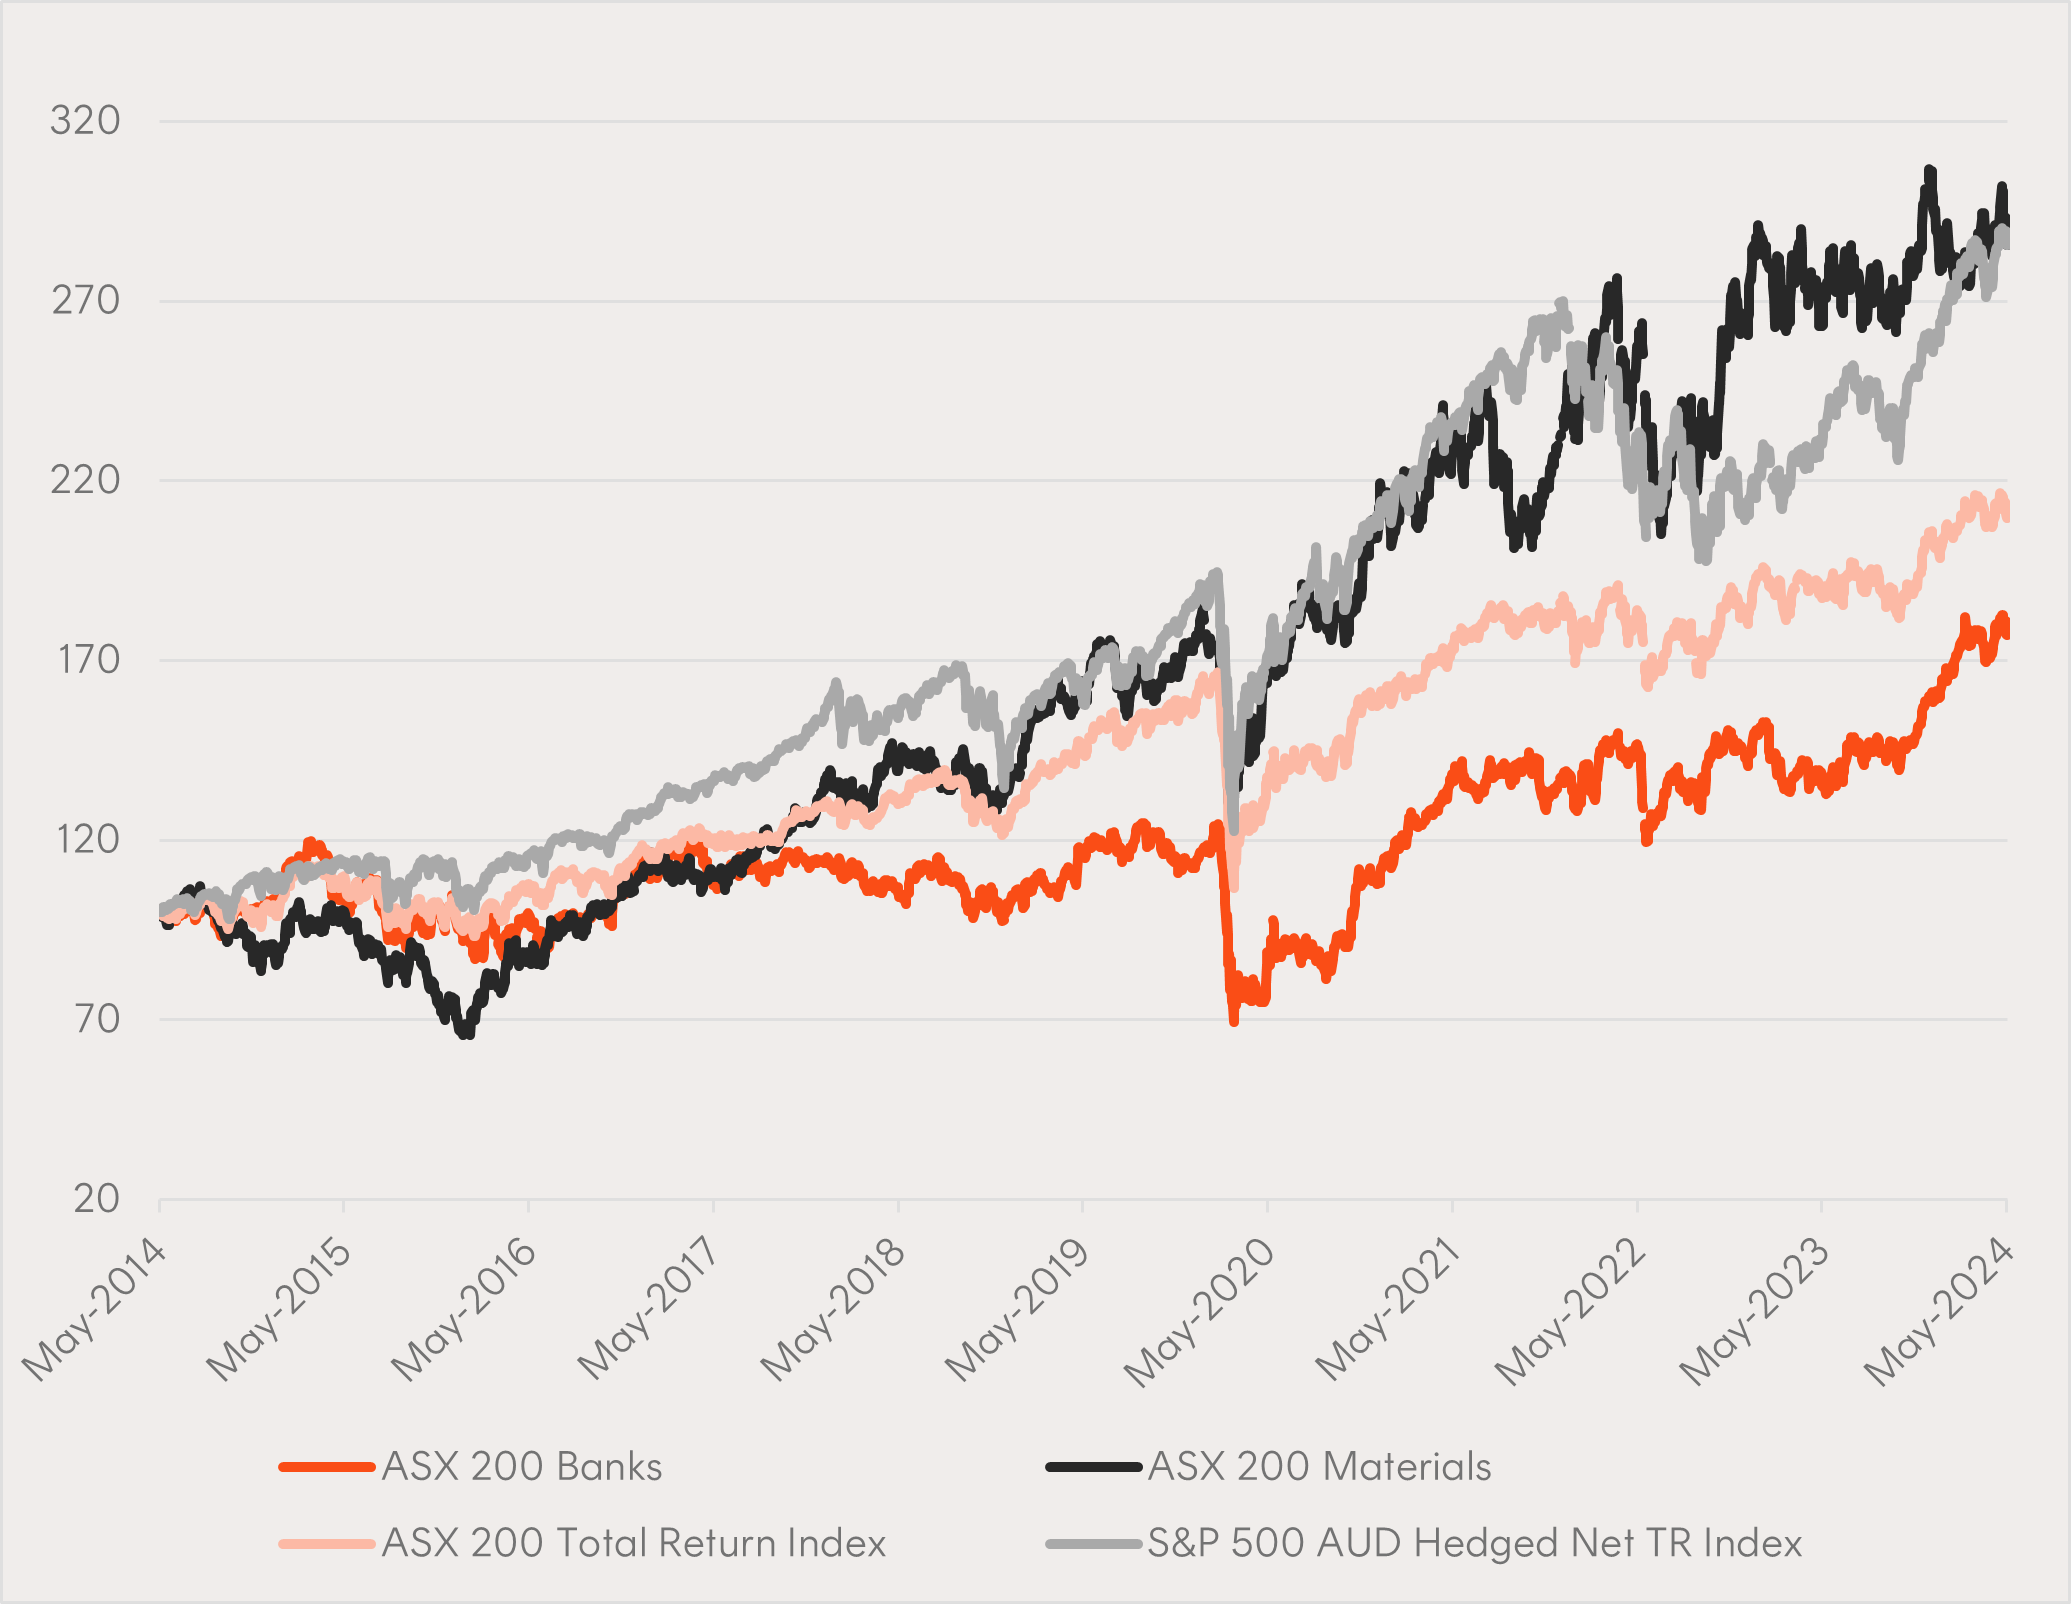
Over the last 10 years, the ASX 200 has significantly underperformed the S&P 500 AUD Hedged Index, yet our Materials sector has kept pace. In terms of what has held our local market back, it’s been our heavy weight to banks (average weight of 24%1) over that period that has been the main culprit.
Chart 3: Total return series of various indices over the 10 year period to 31 May 2024 (indexed to 100 as at 31 May 2014)
Source: Bloomberg, Betashares; as at 31 May 2024. Past performance is not indicative of future performance. You cannot invest directly in an index.
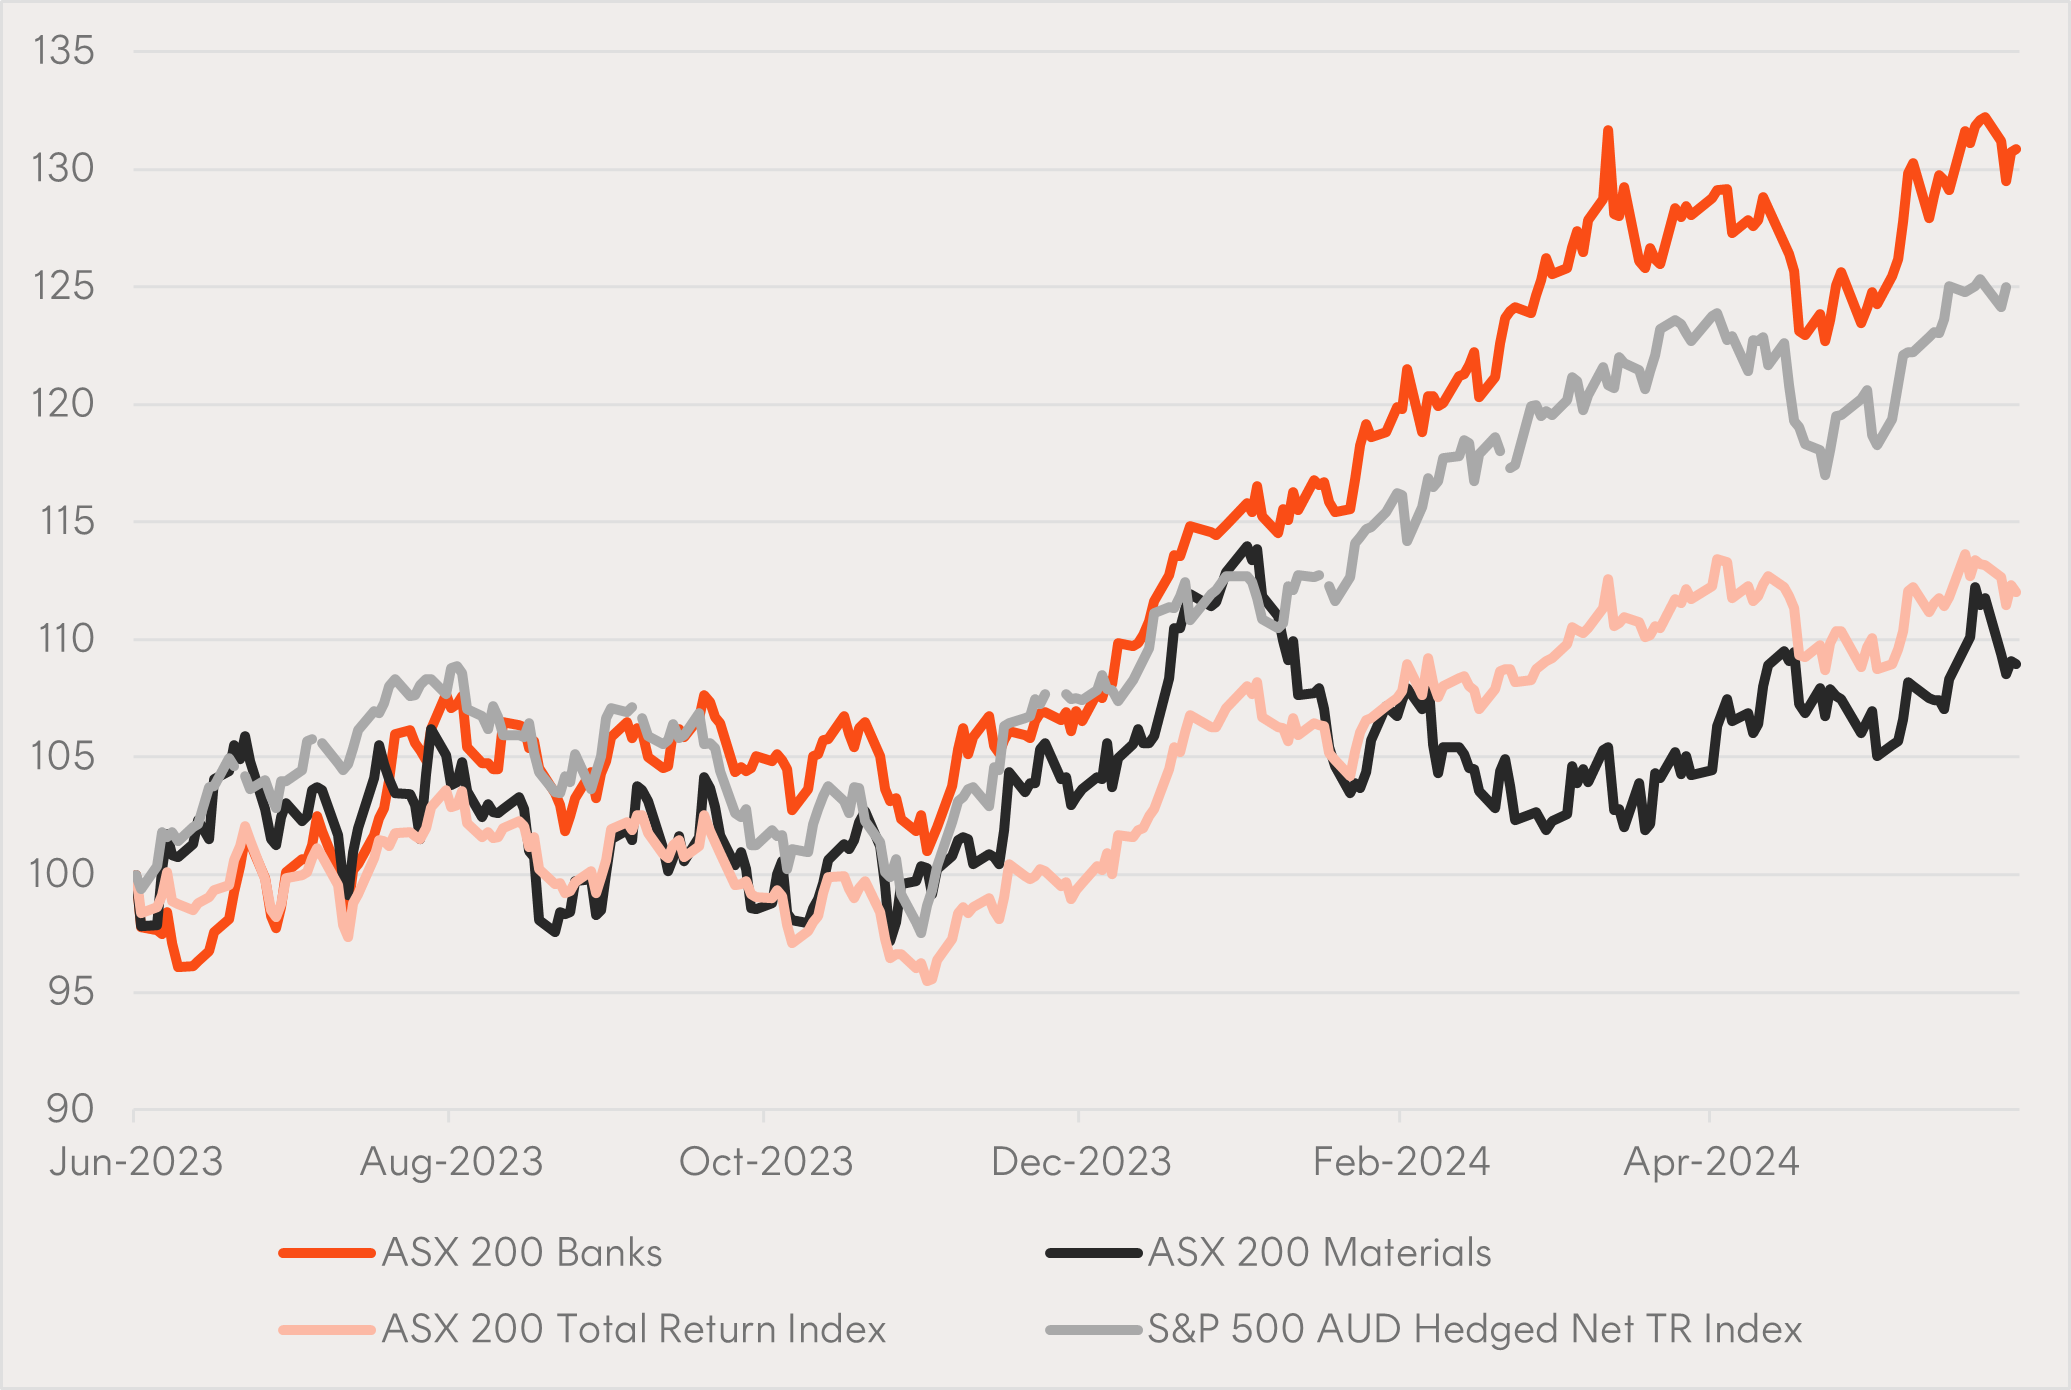
However, Australian banks have been some of the top performers recently, with the ASX 200 Banks Index outperforming the S&P 500 AUD Hedged Net TR Index over the year to 31 May 2024.
Despite falling net interest margins, Australia’s biggest banks have rallied from the beginning of the year as competition eases and bad debts have remained low overall.
Chart 4: Total return series of various indices over the year to 31 May 2024 (indexed to 100 as at 31 May 2023)
Source: Bloomberg, Betashares; as at 31 May 2024. Past performance is not indicative of future performance. You cannot invest directly in an index.
4 – The bigger, the better
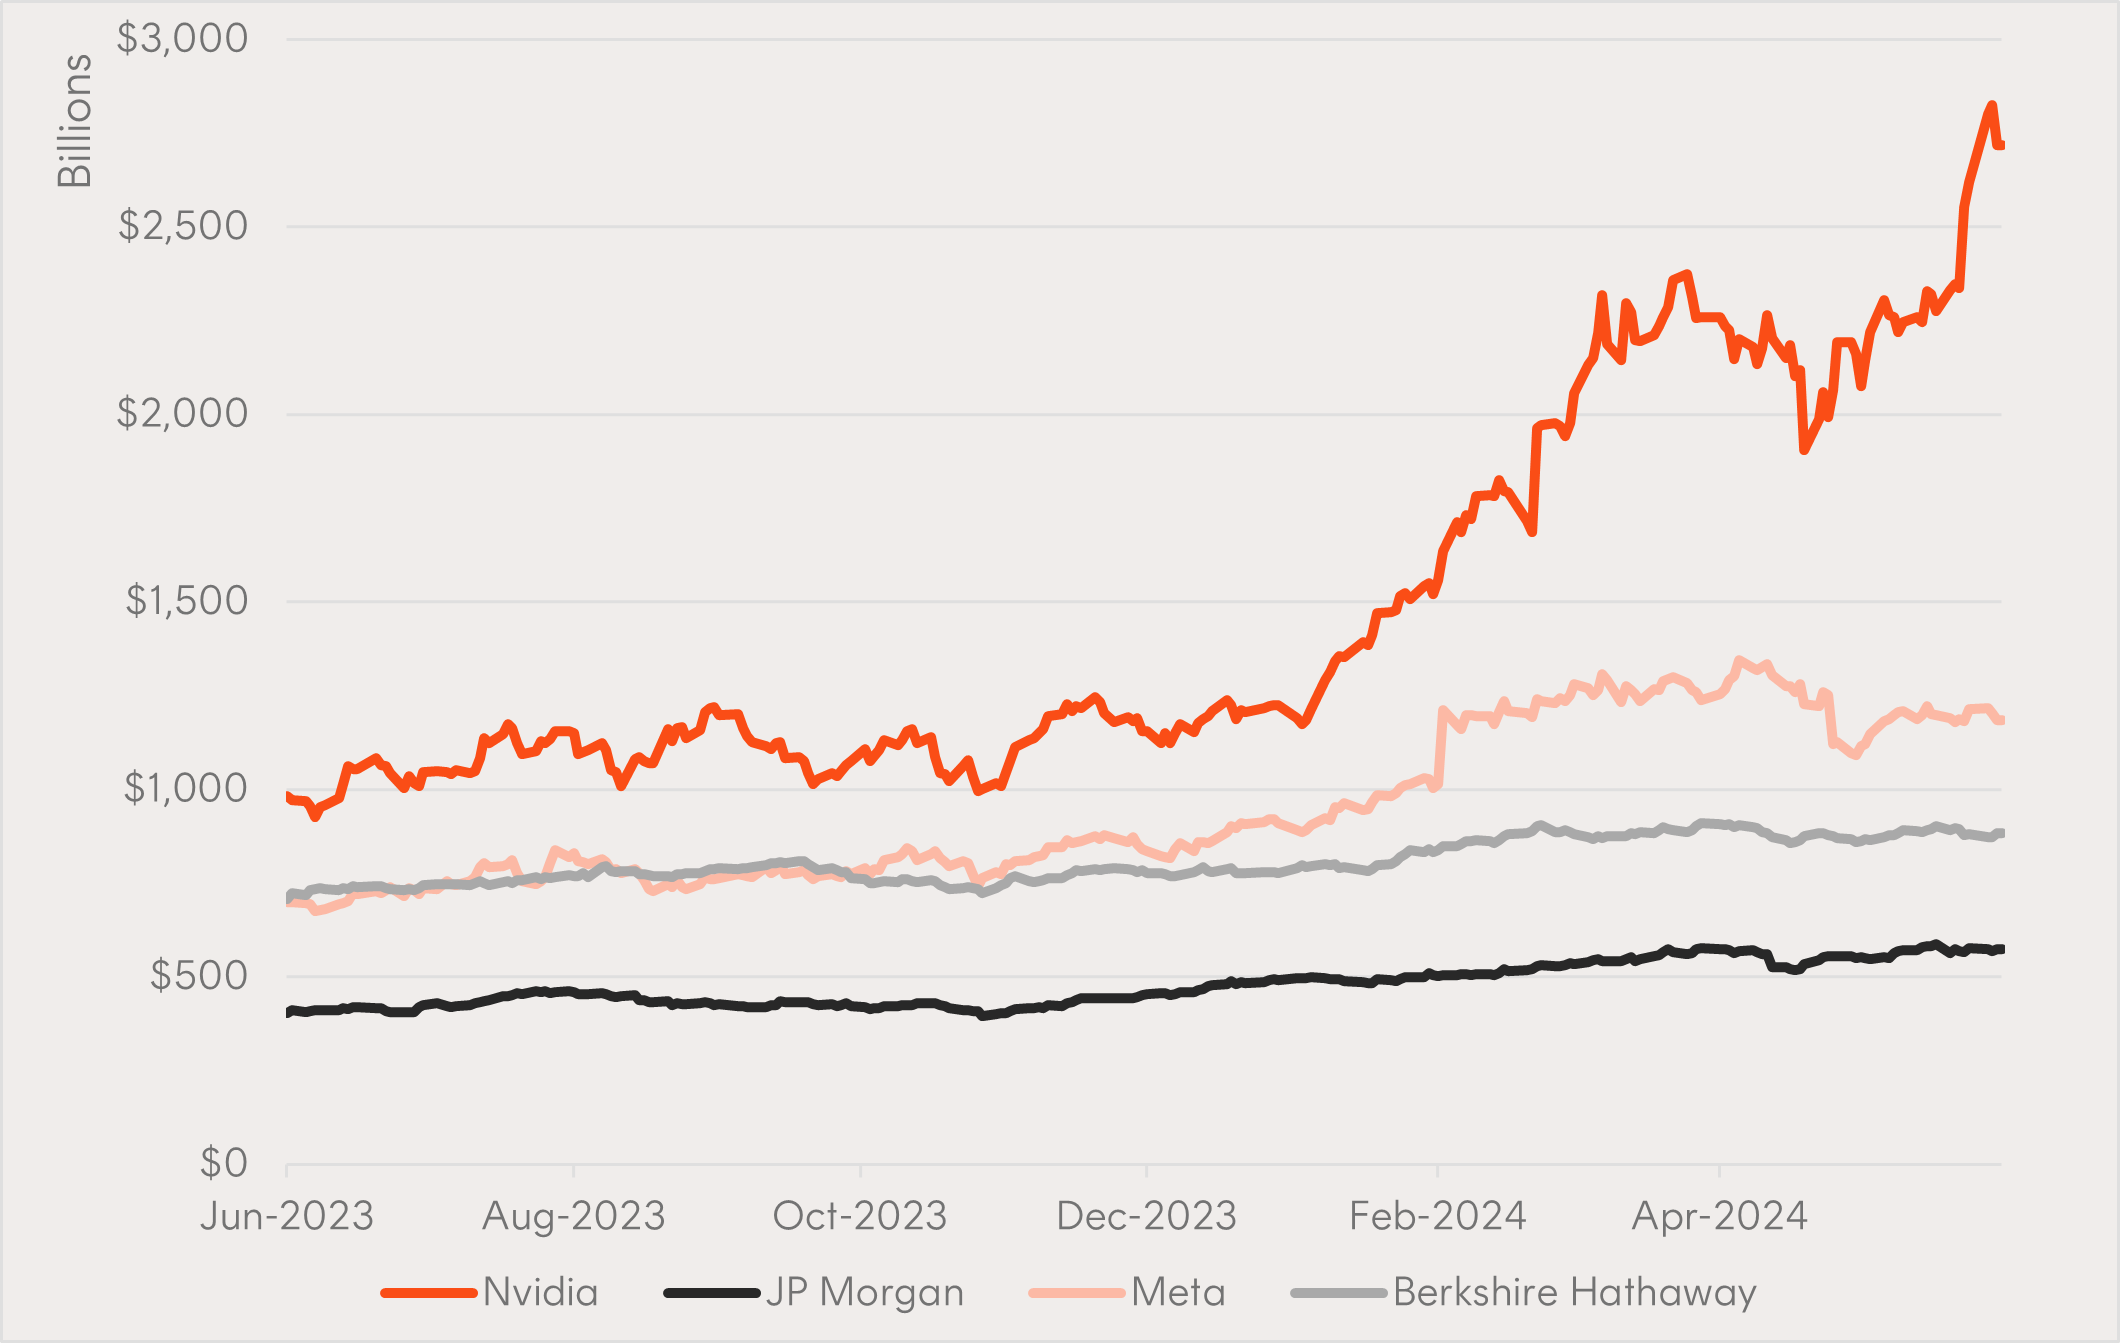
NVIDIA continued its rally in May after reporting first quarter revenues of $26 billion – a growth rate of over 260% YoY.
The designer of advanced logic chips is now the third largest company in the world, with a current market cap of around $2.7 trillion – that’s bigger than JP Morgan, Meta and Berkshire Hathaway combined!
Chart 5: Market capitsalisations of NVIDIA and other selected companies over the year to 31 May 2024
Source: Bloomberg, Betashares; as at 31 May 2024. Past performance is not indicative of future performance.
That’s all for now, but we’ll be back next month with more interesting insights as the race between central banks continues towards a soft landing.
Source:
1. Bloomberg. Over the 10-year period to 31 May 2024. ↑

