Liberation Day
5 minutes reading time
A wrap up of the charts catching our eye over the past month.
Global equity markets have had a strong run for the first half of 2024 supported by falling inflation and the commencement of a global easing cycle by several major central banks. Whilst the market outlook remains positive for the second half of the year, the ride from here may be volatile with political uncertainty in the US and French elections.
1 – Can bonds outperform equities?
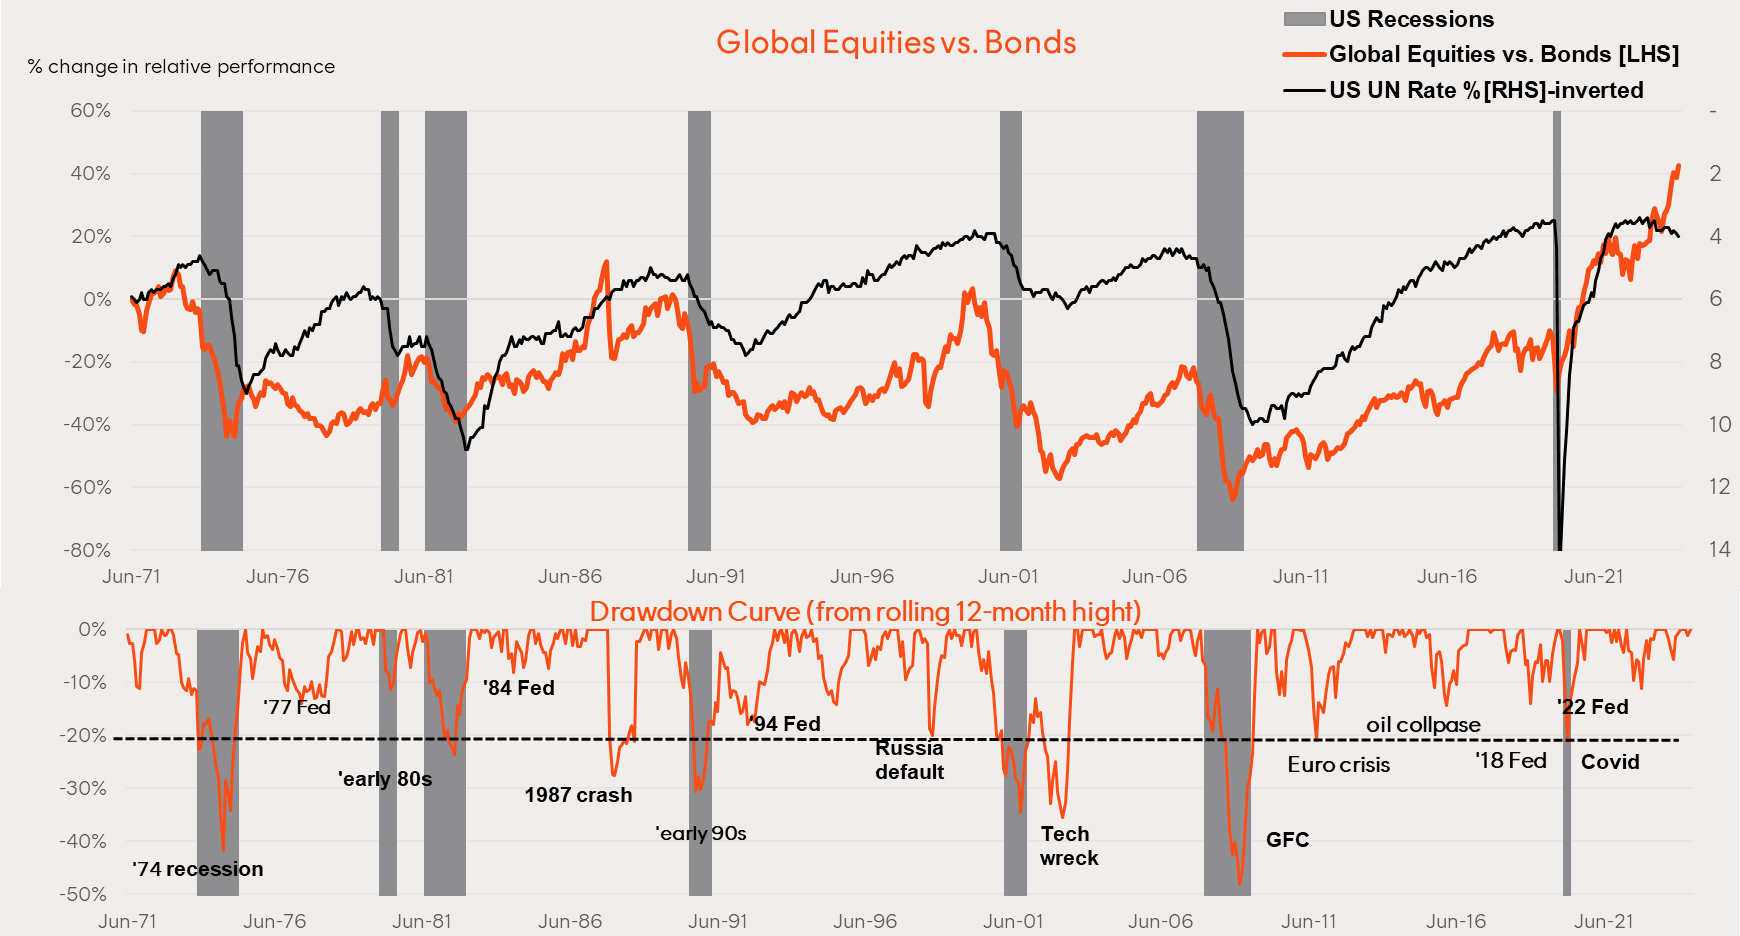
Some investors may be surprised to know global equities have not consistently outperformed global bonds throughout history. Over the 40 years to the 2008 global financial crisis, bonds outperformed equities by a cumulative 60% – despite equities generally experiencing higher volatility and risk.
Higher interest rates in previous decades and several large equity bear markets supported fixed income returns over equities.
However, global equities have unwound this trend since 2008 with strong fiscal stimulus supporting economic growth and interest rates falling to zero in the fallout of the Covid pandemic.
In terms of relative performance over the cycle, declines of more than 20% in terms of relative global equity to bond performance are rare absent a US recession. Pullbacks of up to 10% or so, however, have usually been associated with Fed tightening cycles that did not turn into a recession – the 2022 episode being the latest example.
Chart 1: Outperformance of global equities vs bonds June 1971 to June 2024
Source: FactSet, Betashares as at June 2024.
2 – Nirvana in US equities
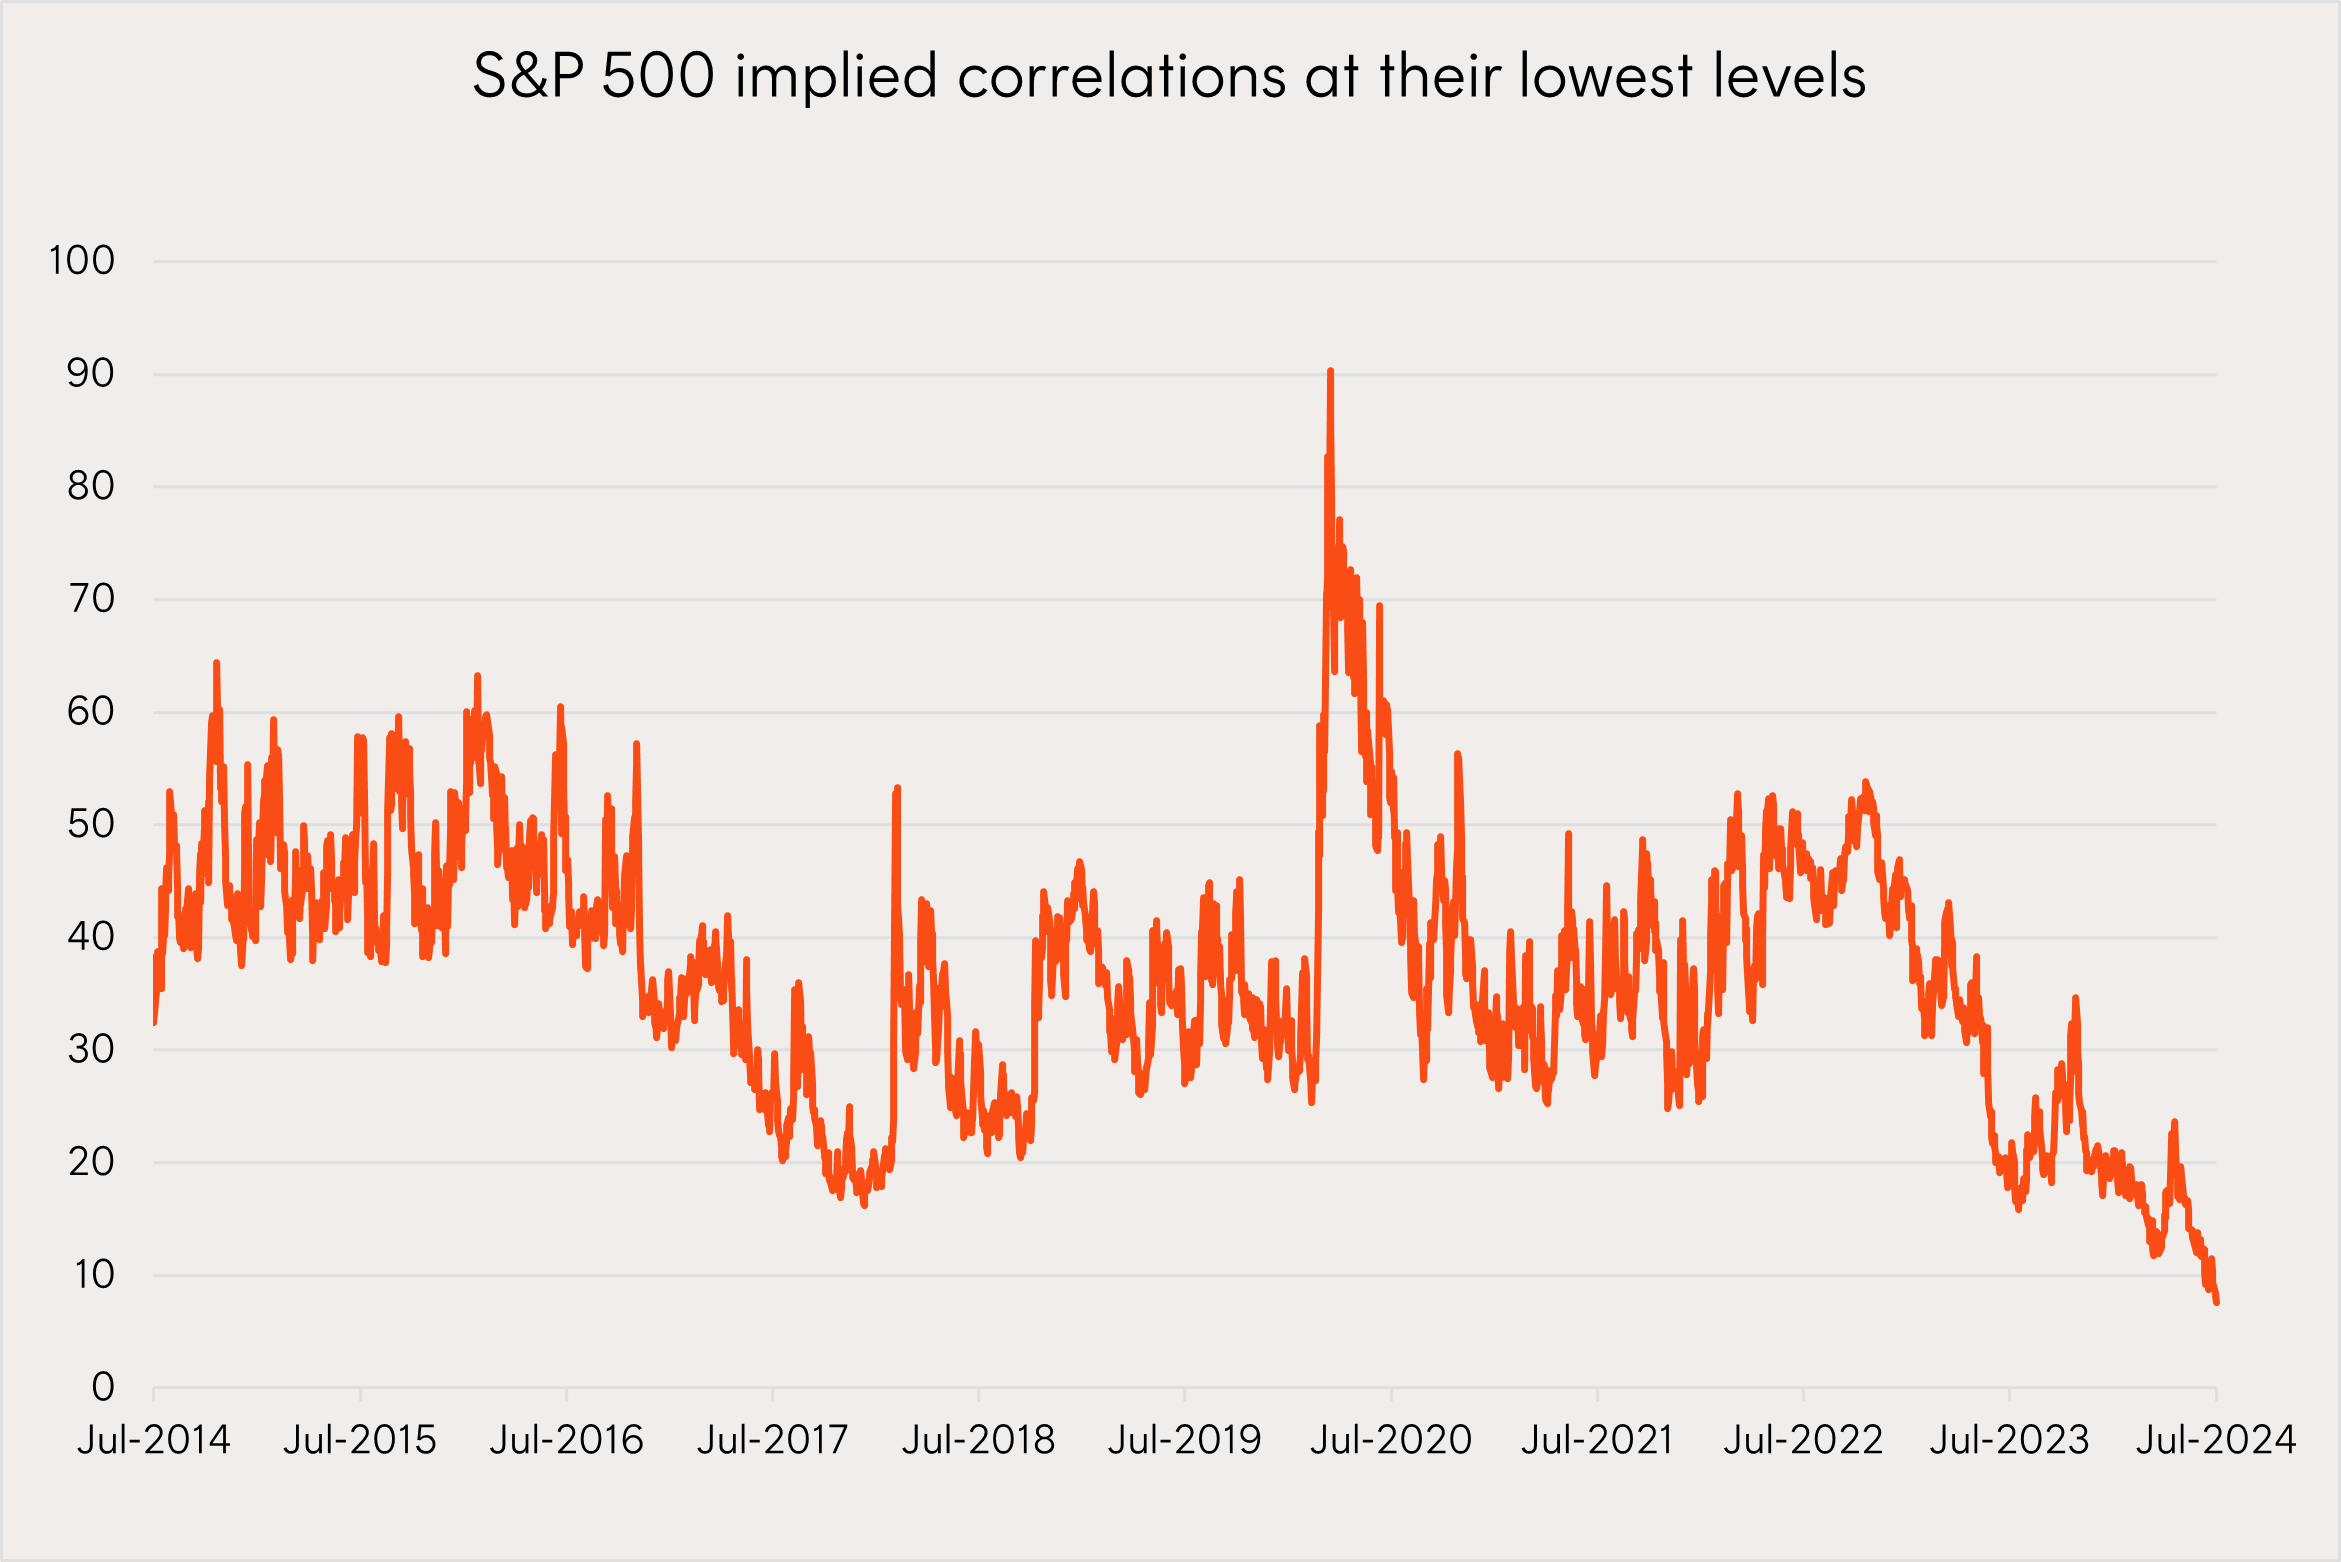
Implied correlations are trading at a historical low (based on available data going back to 2006).
Why does this matter?
- We know that during crises, correlations (both realised and implied) jump towards +1 (+100 in the chart below),
- An implied correlation of 0.076 implies that the market is not worried about that prospect.
Chart 2: S&P 500 3-month option-implied average stock correlation
Source: Bloomberg as at 3 July 2024.
3 – The race to US1tn – S&P 500 v #10
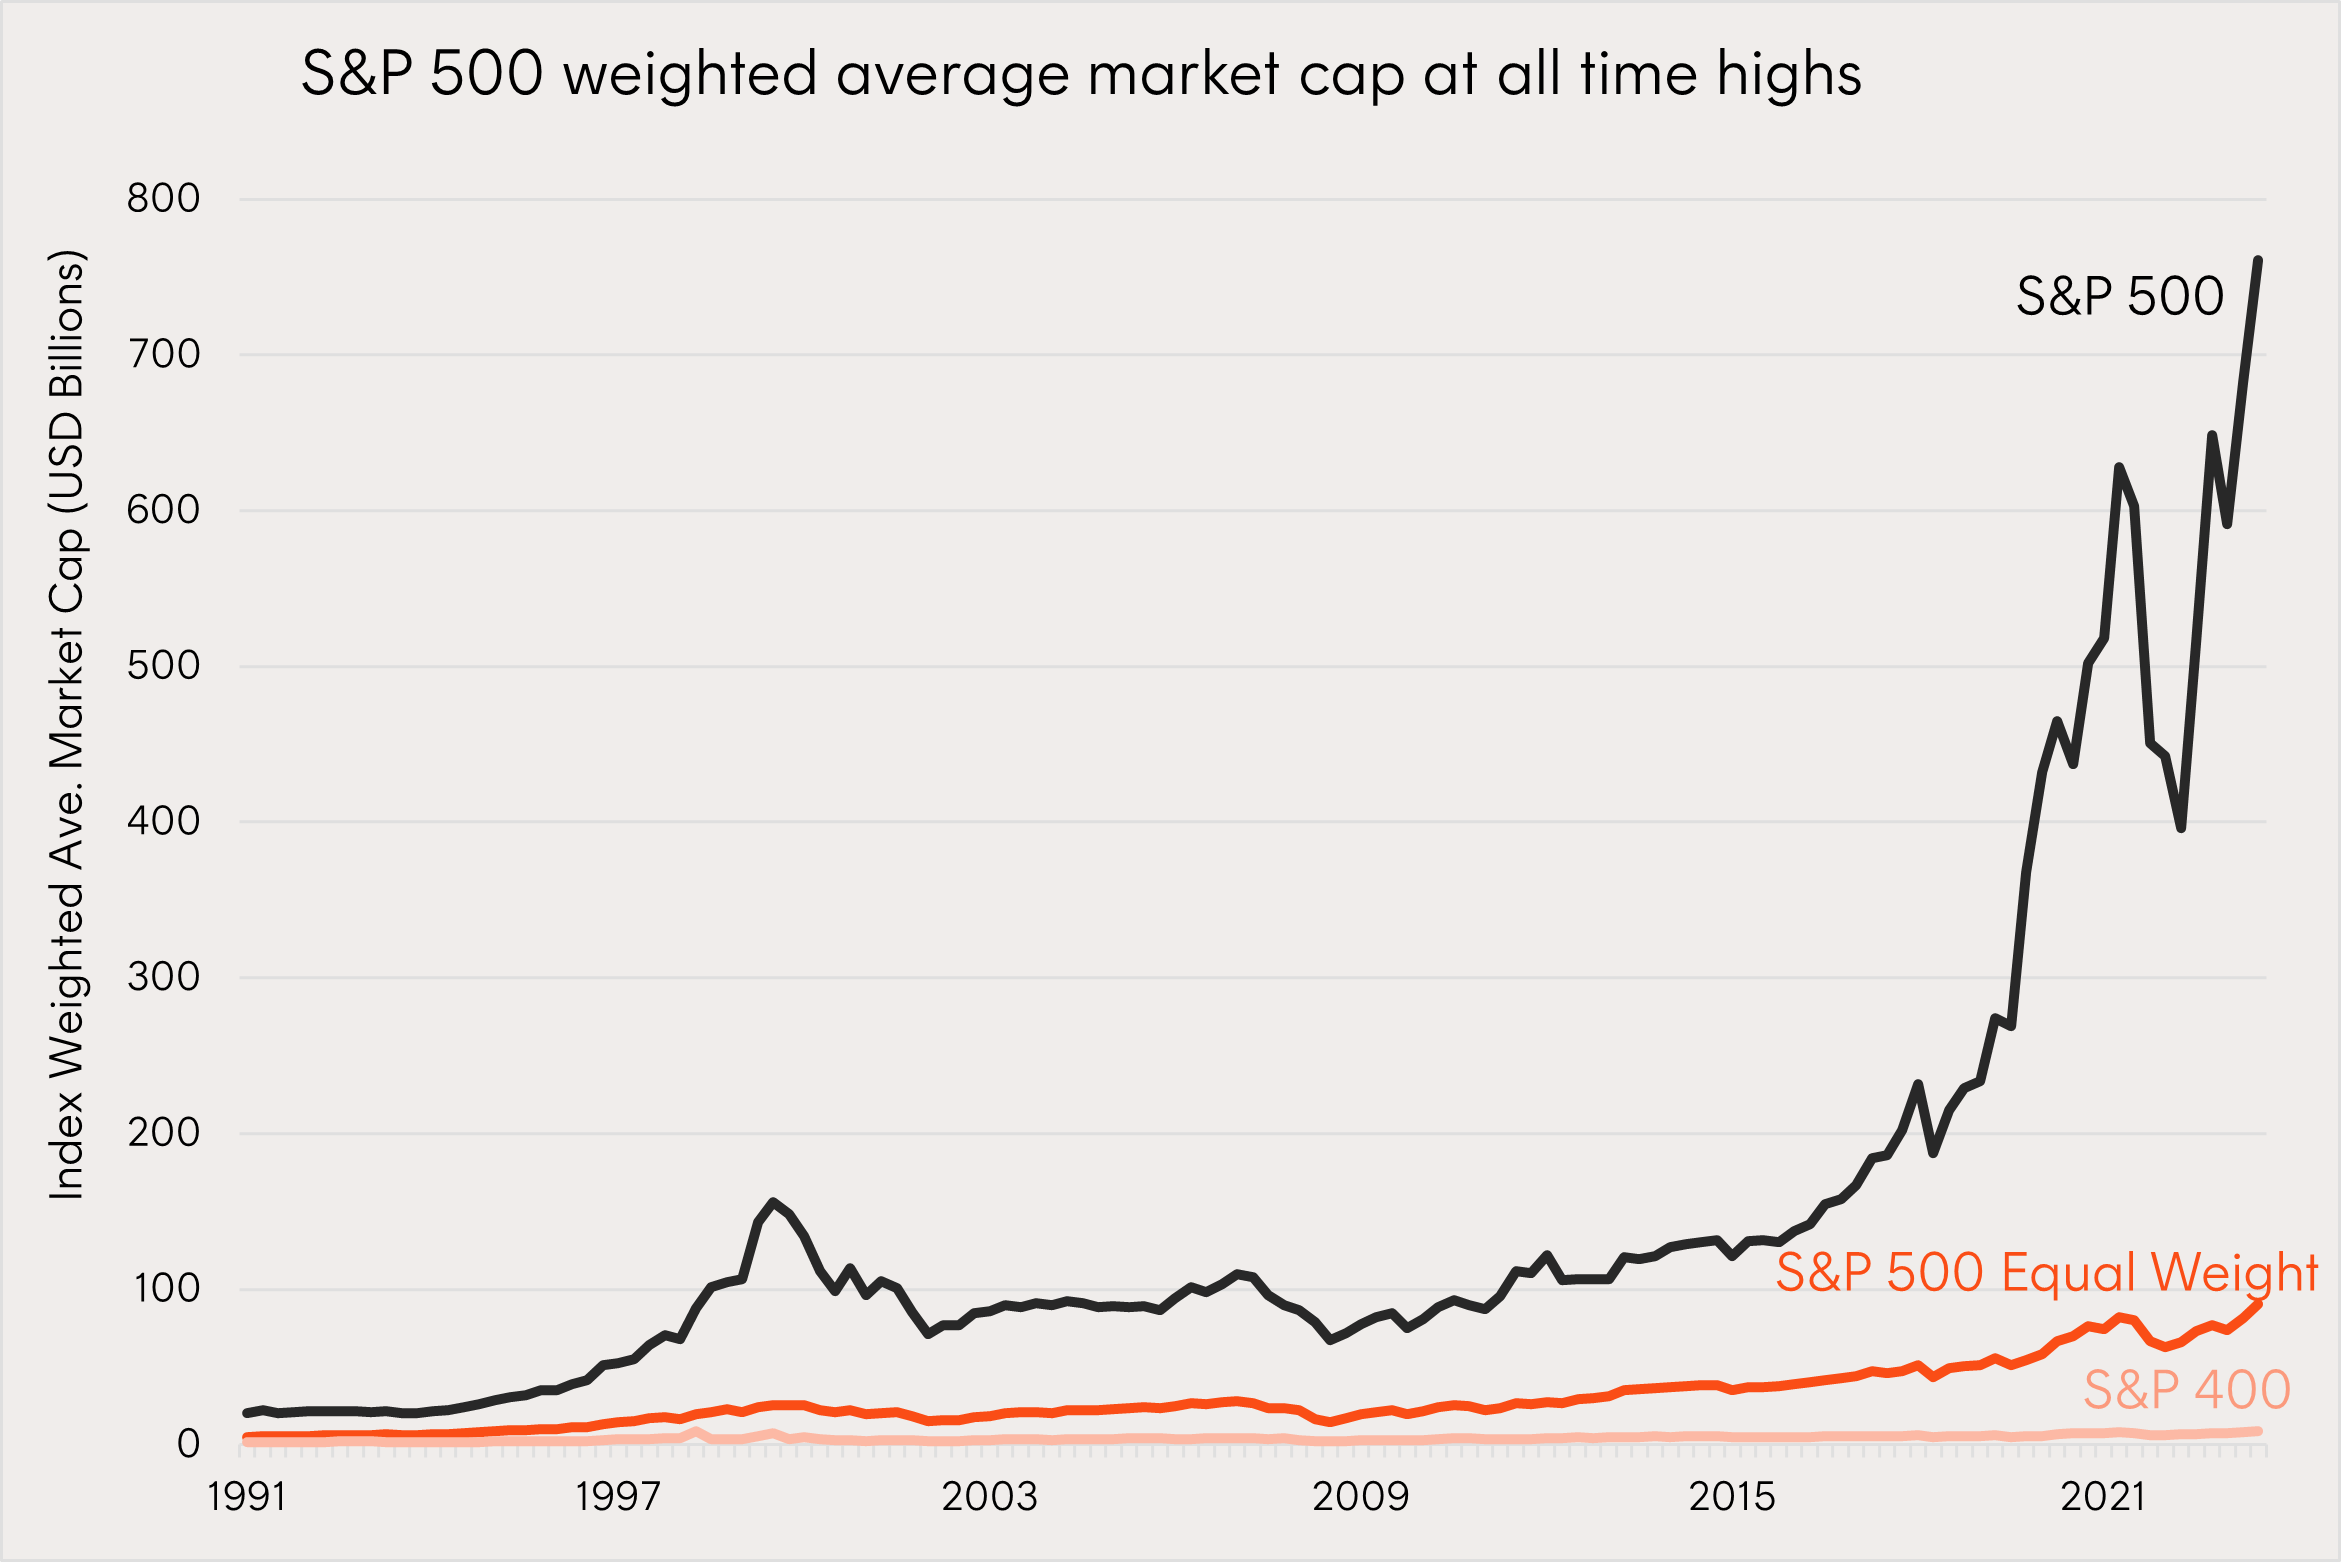
The S&P 500 weighted average market cap is rapidly approaching the USD1tn mark as the size of its largest constituents keep getting bigger.
This is particularly remarkable given that only 9 listed companies have ever reached the US1tn milestone that the index is nearing.
Could the index possibly reach an average size of US1tn before a 10th company?
Chart 3: Index-weighted average constituent market capitalisation
Source: Bloomberg, S&P Dow Jones LLC. Quarterly data from December 1991 to June 2024.
4 – US equities push on
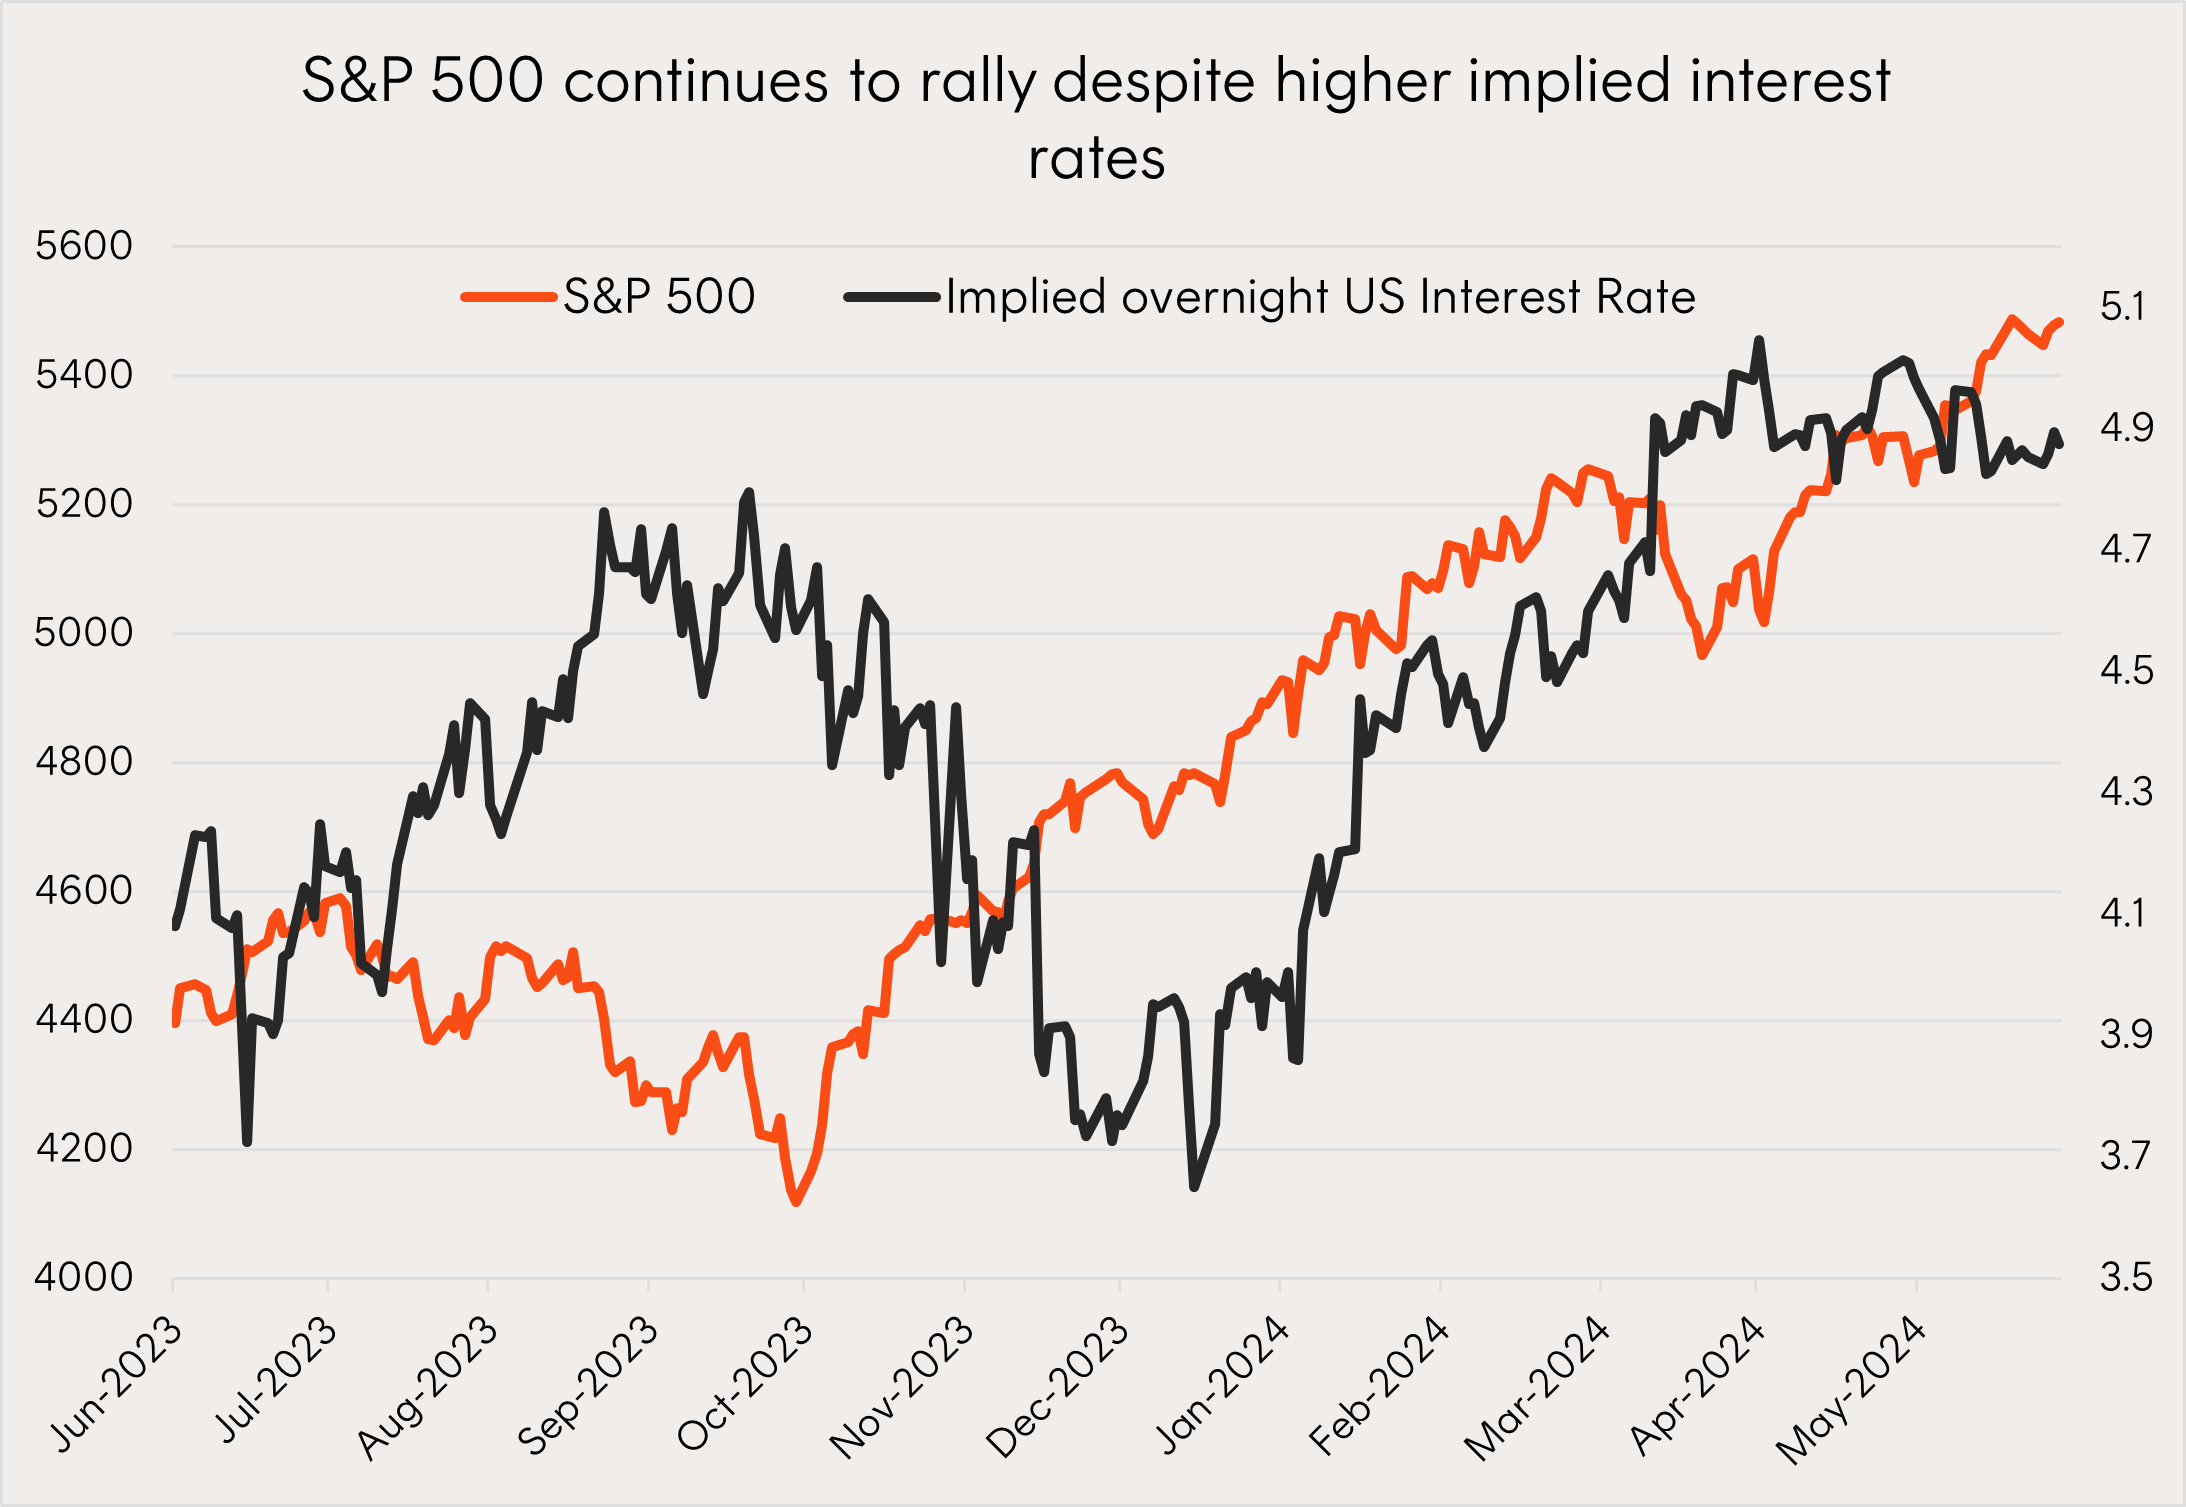
Whilst the S&P 500 fell in in the third quarter of 2023 as implied interest rates rose to a high of 4.8%, the US equity benchmark has instead rallied since the start of the year in the face of these levels being reached once again.
Strong earnings growth from large cap tech companies has pushed the S&P 500 to all-time highs despite implied rates remaining at elevated levels.
Chart 4: S&P 500 and US Implied Overnight Interest Rate
Source: Bloomberg, Betashares; as at 30 June 2024. Past performance is not indicative of future performance. The US Implied Overnight Interest Rate is an estimated forward rate for the US using the futures model.
5 – Political and economic uncertainty in the UK and Europe
Across the pond in the UK, newly elected Prime Minister – Keir Starmer faces the challenge of reinvigorating economic growth which has plateaued since the pandemic.
Chart 5: UK quarterly Gross Domestic Product growth

Source: Bloomberg, Betashares; as at 31 March 2024.
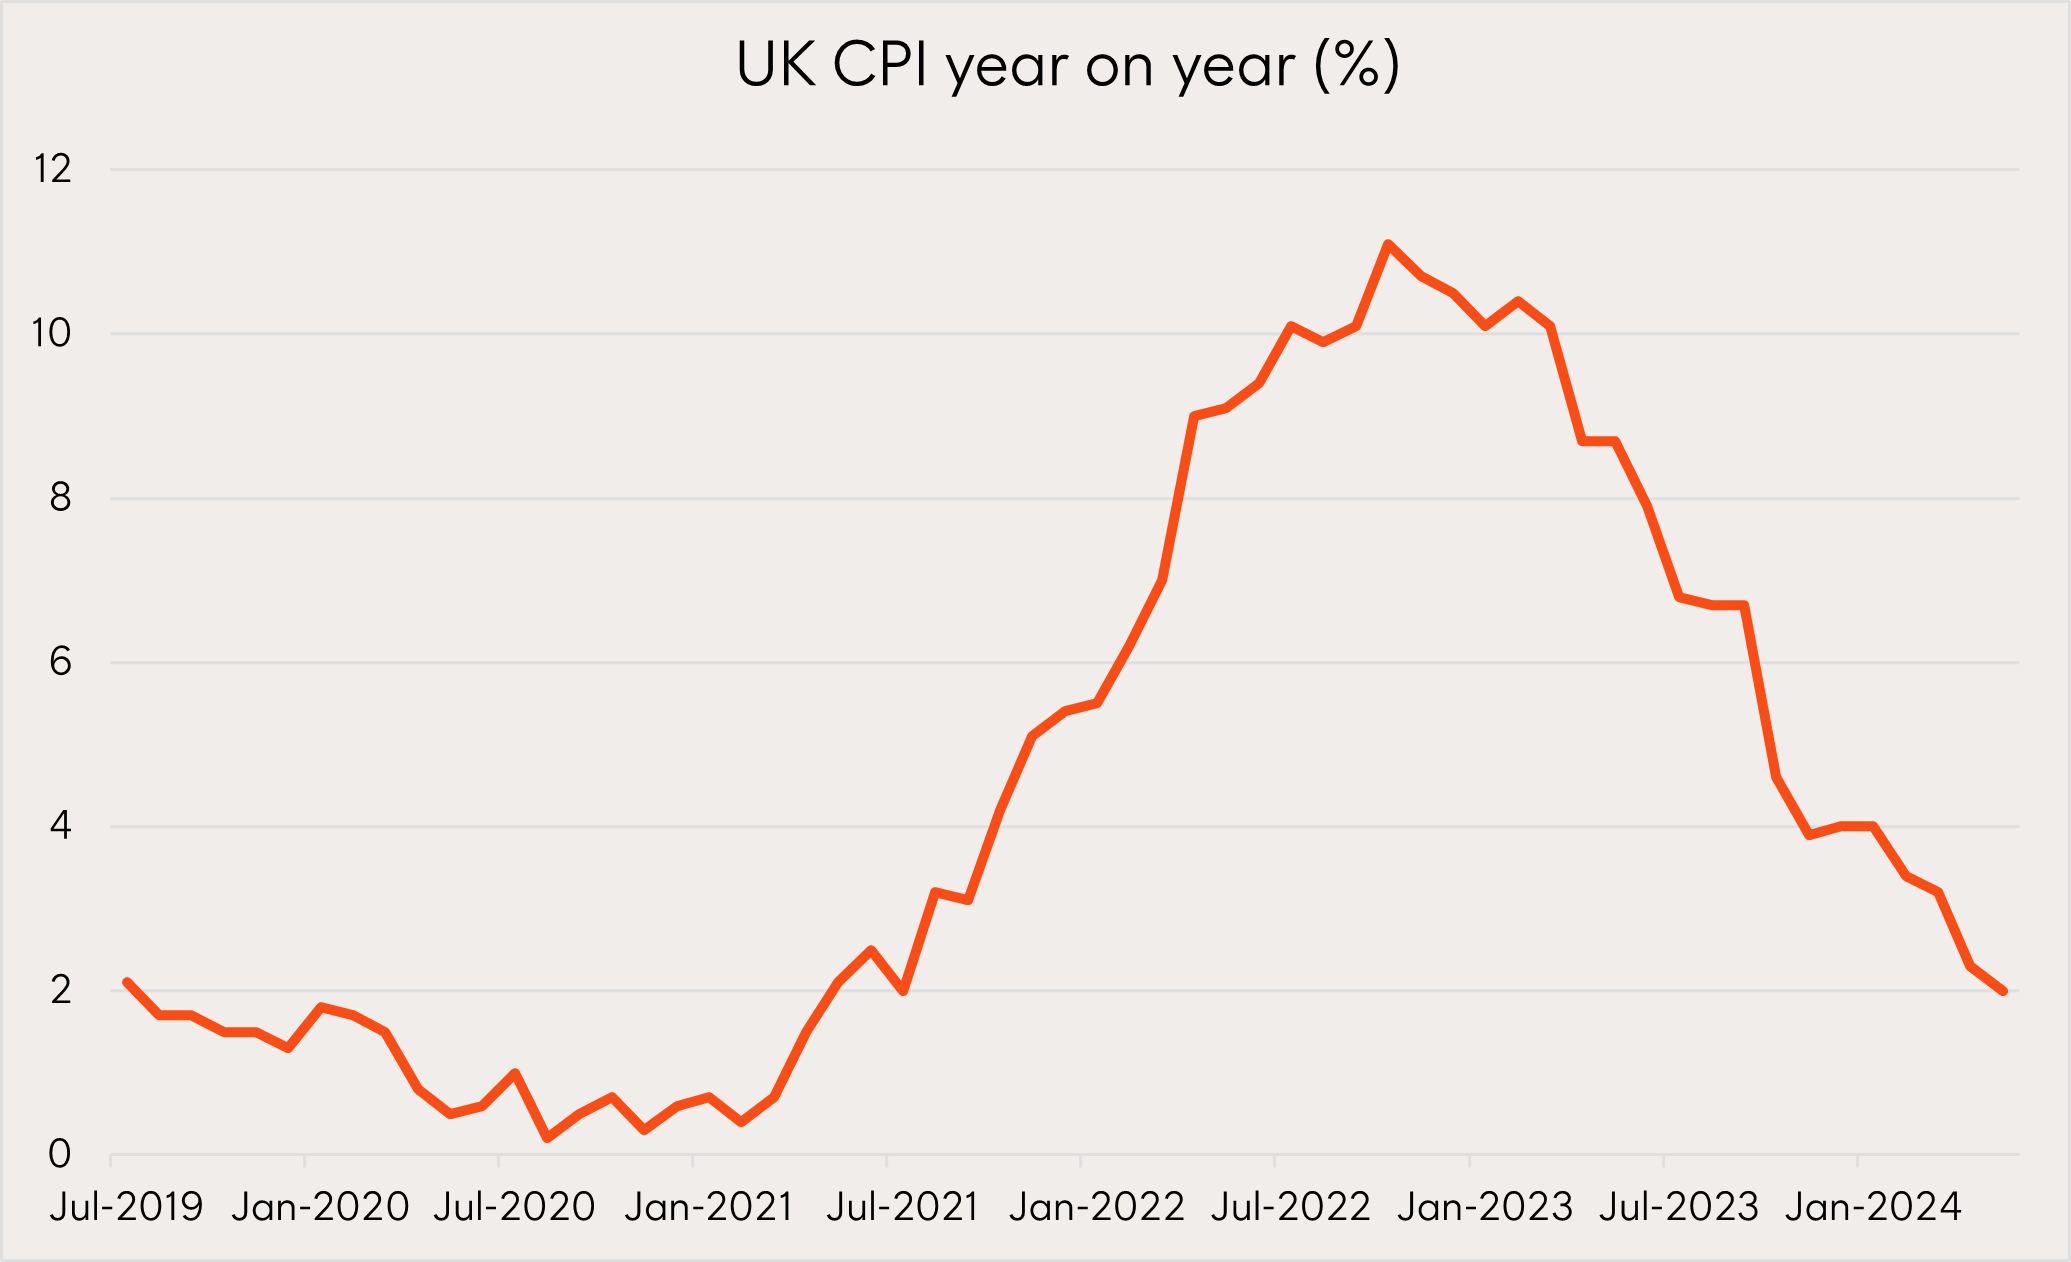
However, whilst growth has been anaemic in the UK, the consumer price index has fallen back to the Bank of England’s 2% interest rate target with restrictive monetary policy working its way through the economy.
Chart 6: UK monthly Consumer Price Index growth
Source: Bloomberg, Betashares; as at 31 May 2024.
The challenge of jumpstarting economic growth will also be a primary focus for the winner of the upcoming French elections, and with uncertainty around which party that might be, volatility in European and global markets could rise from here.
That’s all for now, but we’ll be back next month with more interesting insights as the second half of the year begins to unfold.


1 comment on this
I am interested high income yields.Can you offer me a choice of 6 etf that fulfill this requirement.