Our rules for momentum investing
10 minutes reading time
This is the final instalment in a three-part series on momentum investing in Australia.
In Part 1, we introduced the concept of momentum investing and the academic research that supports its efficacy across time, countries and asset classes.
We then introduced the MTUM Australian Momentum ETF in Part 2, which seeks to track an index that has been specifically designed as a systematic approach to momentum investing.
Part 3 of our series will highlight the advantages of incorporating momentum with other key return drivers. Over the years, academic researchers have developed statistical models that attempt to explain the returns of a diversified portfolio from a small number of underlying causes or factors.
The Capital Asset Pricing Model (CAPM) for example used only one variable to compare the returns of a portfolio to the returns of the market (i.e. market beta). In contrast, the Fama-French 3 factor model added 2 additional factors to the CAPM, being size and value, which improved the explanatory power of the model to over 90% compared to around 70% from the CAPM.
Subsequent models such as Mark Carhart’s 4 factor model included momentum which increased yet again the explanatory power to over 95% of a diversified portfolio’s returns to these underlying factors, while newer competing models included quality metrics such as profitability which eliminate almost all the anomalies that exist with earlier models.
All these key factors:
- Market beta;
- Size;
- Value;
- Momentum; and
- Quality,
are not only grounded in academic literature1, but have the following in common which explain why they are still relevant today:
- They hold across long periods of time;
- They hold across countries, regions, sectors and even asset classes;
- They hold for different definitions of the metric;
- Are investable; and
- There are logical or behavioral reasons that explain the past and expectations for the future.
In this article we will consider how to construct a diversified portfolio built on these time-tested factor return drivers to generate more efficient outcomes.
What is critical in the optimisation process is having the building blocks delivered in a systematic and transparent manner, removed from human biases. This is where transparent low cost passively managed ETFs become valuable tools, allowing access to each return driver in an unbiased and consistent manner.
If an investment process is subjective then human biases can lead to inconsistencies and style drift, making it difficult to optimally blend the factors together to achieve the most efficient results.
For example, the average actively managed Australian large cap equities strategy holds 2.4% in cash2. This may be for a number of reasons, including having a bearish bias on the market, a lack of current opportunities or to allow flexibility around capital raisings. However, holding a material amount of cash reduces the most significant return driver of a portfolio, being market beta.
Assuming market beta returns on average 9% p.a. with an average cash holding of 2.4%, then the impact on returns would be negative 0.22% p.a. Conversely, the typical passively managed fund or ETF will hold almost nil cash, delivering virtually the entire market beta embedded in that strategy.
Blending factors to create a more efficient portfolio
The AQLT Australian Quality ETF is designed to track the performance of 40 high quality companies, while the QOZ FTSE RAFI Australia 200 ETF through its rebalancing mechanism weights a portfolio of stocks which exhibit value characteristics.
We will explore in the following section why these time-tested return drivers, including MTUM, can create more efficient outcomes.
We can see from the table below that AQLT, QOZ, and MTUM exhibit a strong exposure to the quality, value and momentum factors respectively.

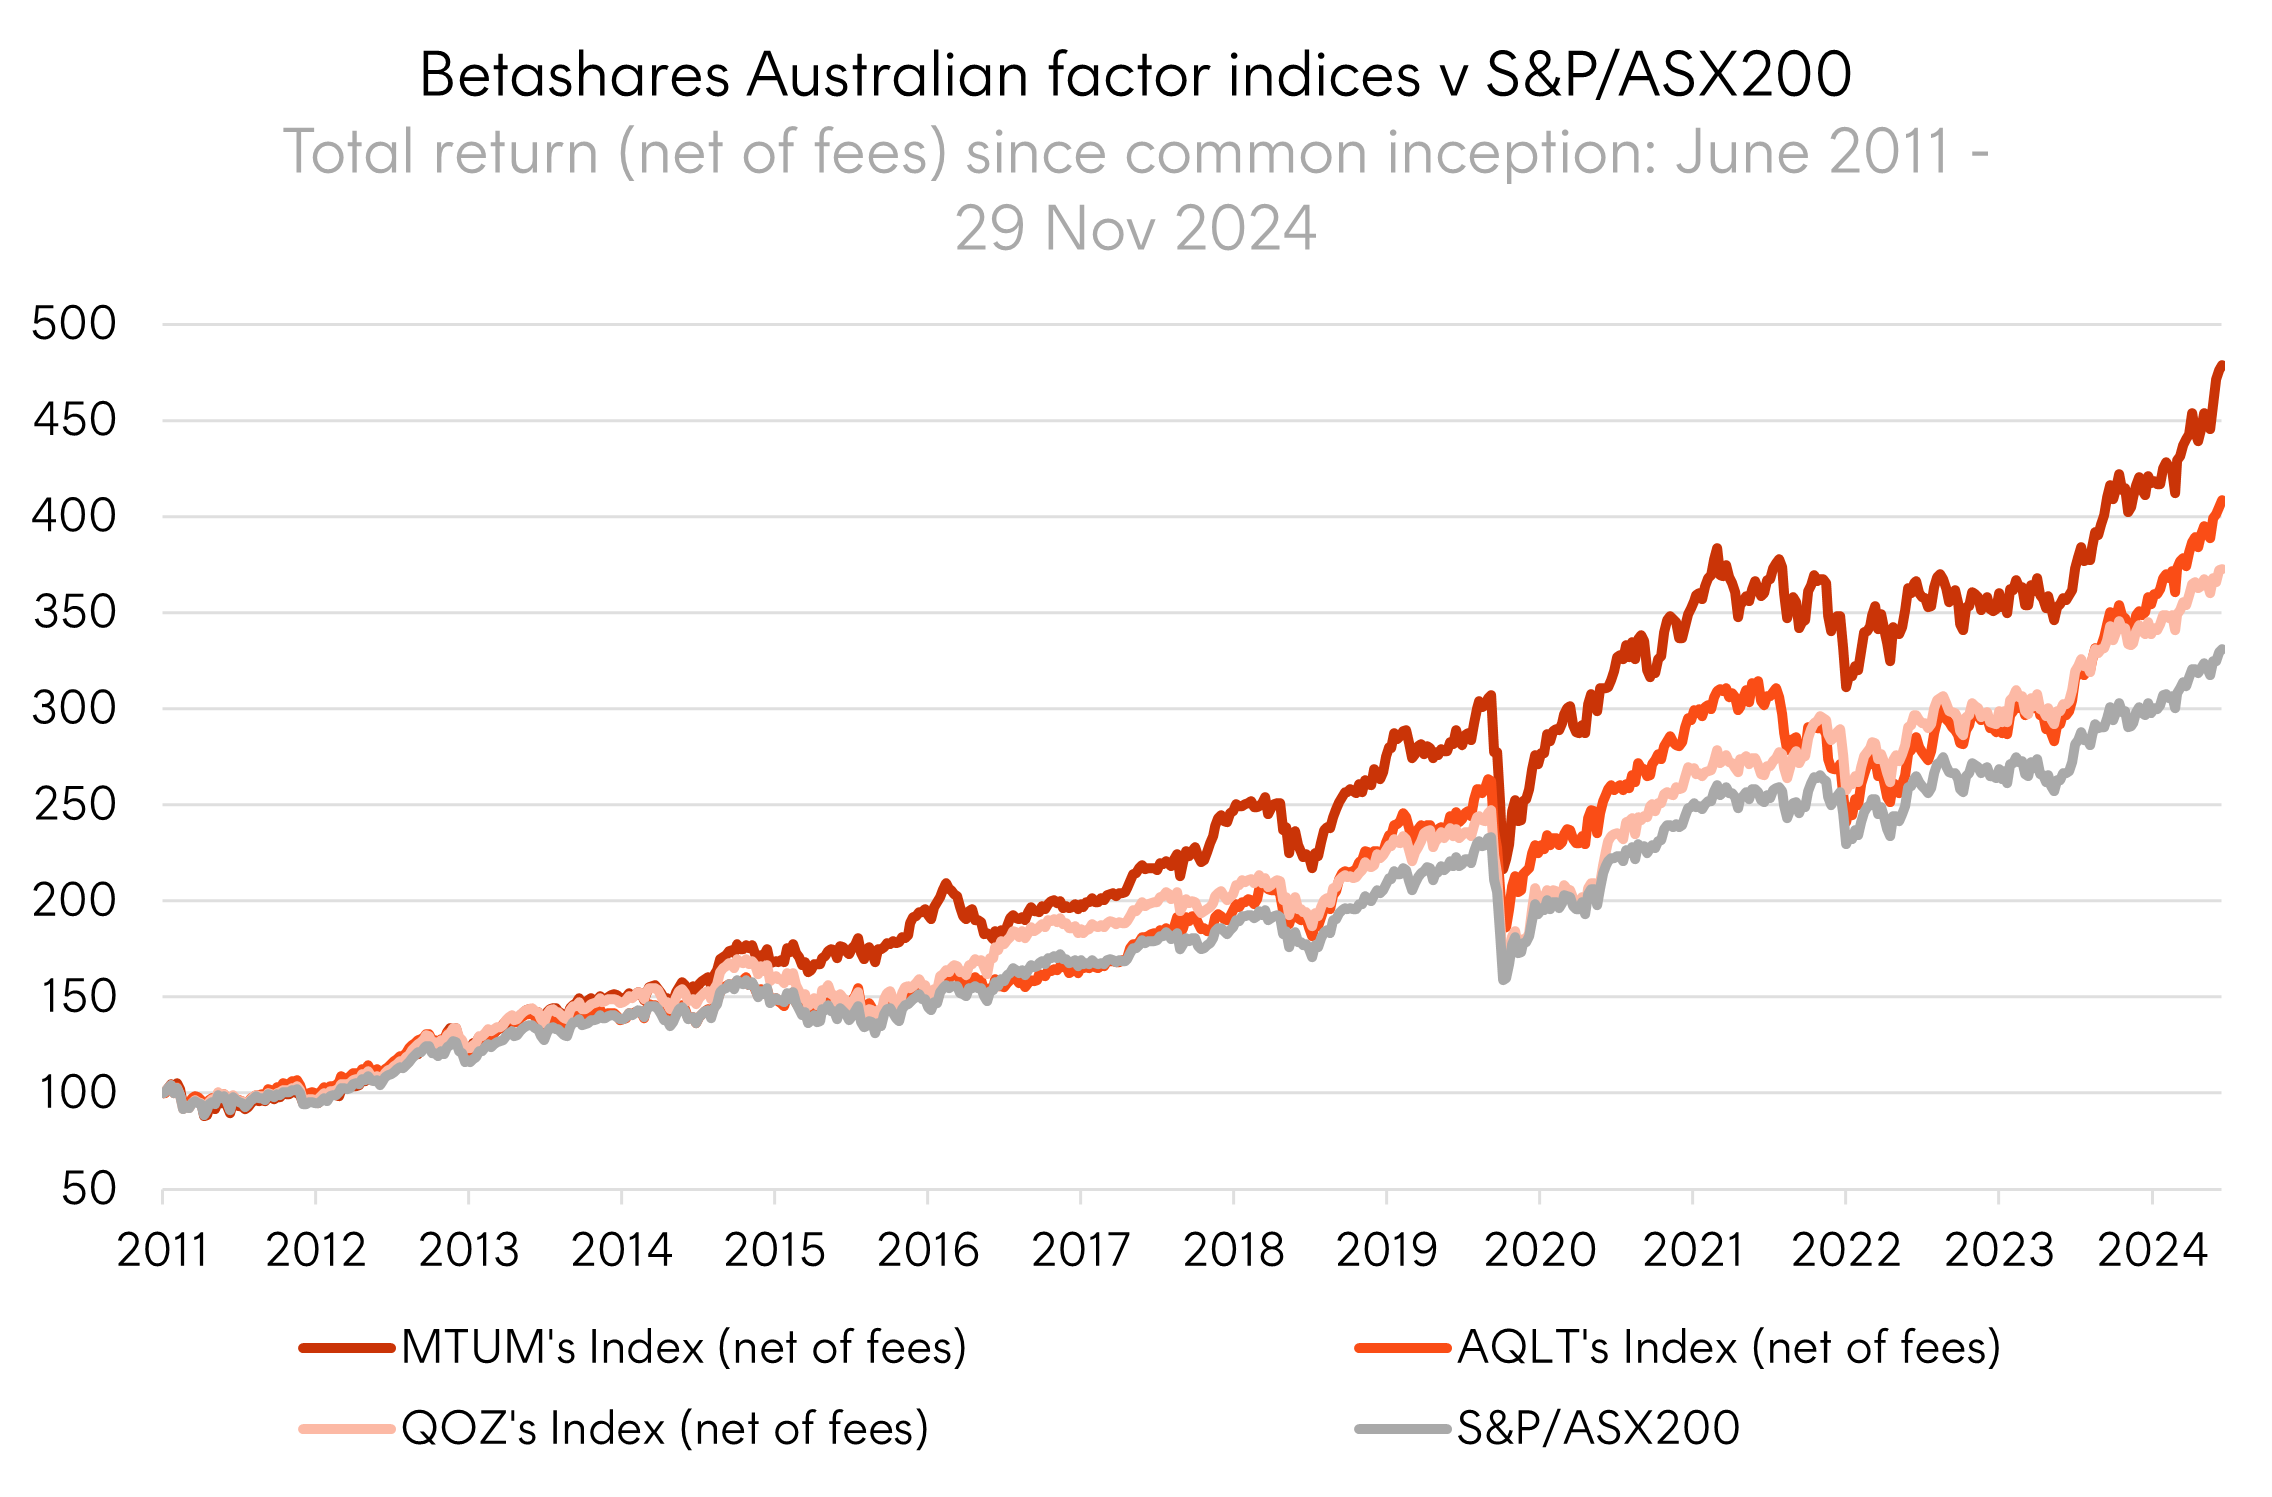
Since common inception, AQLT, QOZ and MTUM have exhibited a positive return premium above the S&P/ASX200 benchmark consistent with the global academic research on the efficacy of factor investing, as shown in the chart below.

Source: Bloomberg, Betashares from 17 June 2011 to 29 November 2024. AQLT’s Index is the Solactive Australia Quality Select Index. QOZ’s Index is the FTSE RAFI Australia 200 Index. MTUM’s Index is the Solactive Australia Momentum Select Index). Performance shown is net of ETF management costs of 0.35% p.a. for MTUM and AQLT, and 0.40% p.a. for QOZ. You cannot invest directly in an index. Past performance is not indicative of future returns of the indices or the ETFs.
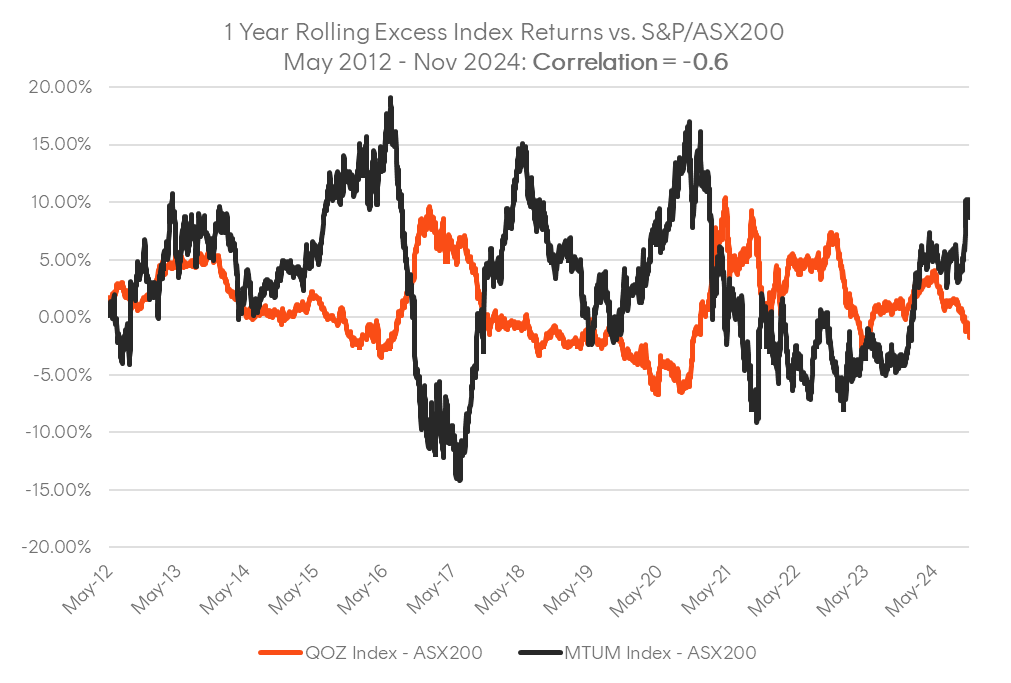
If market beta on average can explain circa 70% of a diversified portfolio’s returns, then the other 30% can be explained by factor excess returns. Factor exposures such as value (QOZ Index) and momentum (MTUM Index) have exhibited 1 year rolling excess returns that are uncorrelated (-0.6).

Source: Bloomberg. As at November 2024. Chart shows index performance (not actual fund performance) to illustrate the potential diversification benefits of using QOZ and MTUM together within a portfolio and does not take into account ETF management costs of 0.35% p.a. for MTUM and 0.40% p.a. for QOZ. You cannot invest directly in an index. Past performance is not indicative of future returns of the indices or the ETFs.
The advantage of blending uncorrelated return drivers together can smooth out the investment journey – i.e. how you get to the end point and that experience along the way can be just as important as the end point itself.
Hence, the goal of maximising the excess returns per unit of excess risk (tracking error or volatility relative to the benchmark) i.e. the information ratio can be used as a metric to measure that investment journey.
The table below highlights the 1-year rolling excess return distribution for each individual factor exposure return as well as an optimal blend which maximises the information ratio. What you will notice is QOZ’s Index (value) has outperformed the benchmark 63% of the time, with a maximum 1 year rolling excess return of 9.24% and a minimum 1 year rolling excess return of -6.83%, the average 1 year excess return (1.28%) is greater than the median (0.87%) which suggests the distribution of 1 year rolling excess returns for QOZ’s index has exhibited positive skew or fatter tails on the positive side which drags up the average.
On the other hand, AQLT’s Index (quality) and MTUM’s Index (momentum) have exhibited a negative skew where the average 1-year rolling excess return is lower than their median suggesting both have fatter negative tails which drag down the average.

Source: Bloomberg. As at September 2024. Table shows index performance (not actual fund performance) to illustrate the benefits of blending different factor exposures, and does not take into account ETF management costs of 0.35% p.a. for MTUM and AQLT and 0.40% p.a. for QOZ. You cannot invest directly in an index. Past performance is not indicative of future returns of the indices or the ETFs.
By optimally blending all 3 return factors together, this resulted in a shift in the excess return distribution to the right, with a longer period of time experiencing a positive 1-year rolling excess return (77.07% of the above time period), while the average and median 1-year excess returns are now almost identical (1.62% and 1.65%), which implies a large reduction in the distribution skew.
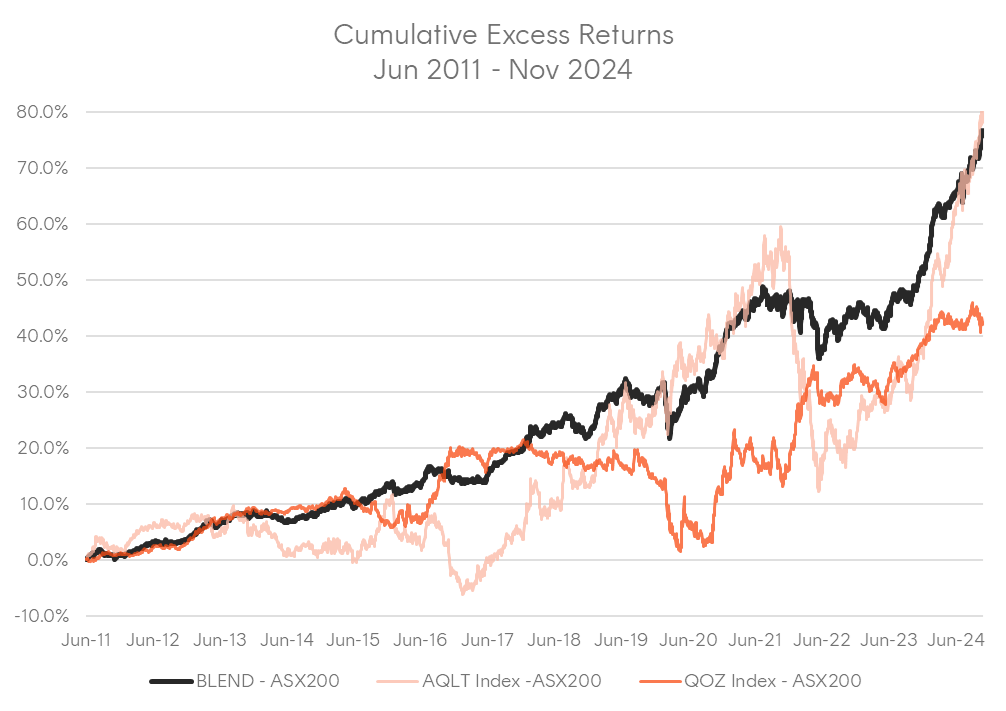
Importantly, the information ratio3 of the blend (1.05) is significantly higher than the information ratio at the individual factor level (between 0.36 and 0.50), resulting in a smoother investment journey as shown in the chart below which highlights the cumulative excess returns of the blend against the individual factor excess returns.

Source: Bloomberg. As at November 2024. Chart shows index performance (not actual fund performance) to illustrate the benefits of blending different factor exposures to reduce overall portfolio volatility, and does not take into account ETF management costs of 0.35% p.a. for AQLT and MTUM, and 0.40% p.a. for QOZ. You cannot invest directly in an index. ‘BLEND’ refers to a blended portfolio which consists of 50% exposure to QOZ, 30% to AQLT, and 20% to MTUM. Past performance is not indicative of future returns of the indices or the ETFs.
Another advantage with passively managed strategies is the generally lower management fees.
The table below shows the Blend portfolio which has a weighted average management fee of 0.375% p.a., significantly lower than the average Australian active large cap equity manager fee of 1.06% p.a.4

Source: Bloomberg. As at 29 November 2024. ‘BLEND’ refers to a blended portfolio which consists of 50% exposure to QOZ, 30% to AQLT and 20% to MTUM. BLEND’s returns are based on each ETF’s underlying index returns net of ETF management costs of 0.35% p.a. for MTUM and AQLT, and 0.40% p.a. for QOZ. Past performance is not indicative of future returns.
The amount of cash an active manager holds can also negatively impact performance outcomes, in addition to fees. If you assume the average active manager holds 2.4% in cash and the market returned 9% that year, then that manager would need to outperform the market by 0.22% p.a. plus the fee charged by the manager (1.06% p.a. on average across the Australian large cap equity universe) just to breakeven with the index benchmark. Overcoming this fee hurdle and cash drag explains why many active managers do not outperform their benchmark net of fees5.
In conclusion, this article focused on the investment merits of using a combination of time-tested return drivers such as market beta, value, quality and momentum through transparent passively managed building blocks in an ETF wrapper.
This structure can help deliver consistent factor attributes in an unbiased manner, have low management fees, almost zero cash drag and are uncorrelated which can significantly increase the chances of maximising the information ratio of a portfolio.
Betashares Australian smart beta ETF offerings to build a more efficient portfolio
The key ETFs discussed in this article were:
- Betashares Australian Momentum ETF (ASX: MTUM)
- Betashares FTSE RAFI Australia 200 ETF (ASX: QOZ)
- Betashares Australian Quality ETF (ASX: AQLT)
For more information on these ETFs, please visit the relevant fund pages using the links above.
There are risks associated with an investment in each of the Funds. Investment value can go up and down. An investment in any Fund should only be made after considering your particular circumstances, including your tolerance for risk. For more information on the risks and other features of a Fund, please see the relevant Product Disclosure Statement and Target Market Determination, available on this website via the links above.
1. Jegadeesh, Narasimhan and Sheridan Titman, “Returns to Buying Winners and Selling Losers: Implications for Stock Market Efficiency Author(s)”, March 1993 ↑
2. Morningstar Australian Active Large Cap Equities Nov 2024. ↑
3. The information ratio (IR) measures portfolio returns beyond the returns of a benchmark, usually an index, compared to the volatility of those returns. ↑
4. Morningstar Australian Active Large Cap Equities Nov 2024 ↑
5. SPVIA Score card: https://www.spglobal.com/spdji/en/documents/spiva/spiva-australia-year-end-2023.pdf ↑


2 comments on this
Hi Thong .
Thank you for the insightful article .
Would you suggest using an equal-weighting to the suggested portfolio ?
Best wishes , Ramon .
Hey Ramon, Thong has highlighted in the table above that a 50% QOZ, 30% AQLT, 20% MTUM combination of the three funds maximises the information ratio over the back-tested period from June 2011 to September 2024.