6 minutes reading time
There are lots of reasons why an Australian investor would want to incorporate investments that provide a different risk/return profile to a broad market exposure into their portfolio core. Depending on what else is in your portfolio, your view of markets or financial objectives, you may prefer to include a fund that tilts towards value, growth or quality stocks, or aims to generate enhanced income or a defensive, lower volatility return profile.
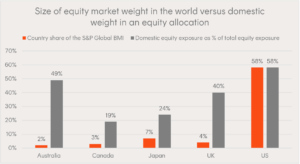
An obvious reason to look beyond broad market beta is our home country bias and the skewed sector makeup of the Australian equity market. In aggregate, Australian investors have amongst the largest home country equity portfolio allocations relative to the size of our equity capital markets, and therefore are skewed to value/cyclical stocks and underweight growth/defensive stocks1.
 Source: S&P Dow Jones Indices, Global Pension Assets Study (GPAS) 2023. As at 31 December 2022.
One alternative for seeking a return premium or exposure beyond just the broad market beta is actively managed funds that employ so-called ‘style biases’, such as structural overweight exposures to companies with high profitability or low price-to-book ratios. These active managers will often highlight the importance of their unique expertise, research process and security selection in constructing their investment portfolio.
However, over the last twenty years, a whole new field in indexing has developed around factor or smart-beta investing. And it turns out that factor investing targets the same risk premia that many active managers have long relied on. Investors can now get exposure to these risk premia through lower-cost funds that seek to track a rules-based factor index.
Regarding active managers that pursue a style bias, we have observed the following:
- Often, any ‘outperformance’ above broad market beta is in fact partially or fully attributable to a factor exposure rather than the manager’s stock specific bets (i.e. true alpha).
- The management costs of rules-based factor index ETFs are generally far lower than active funds.
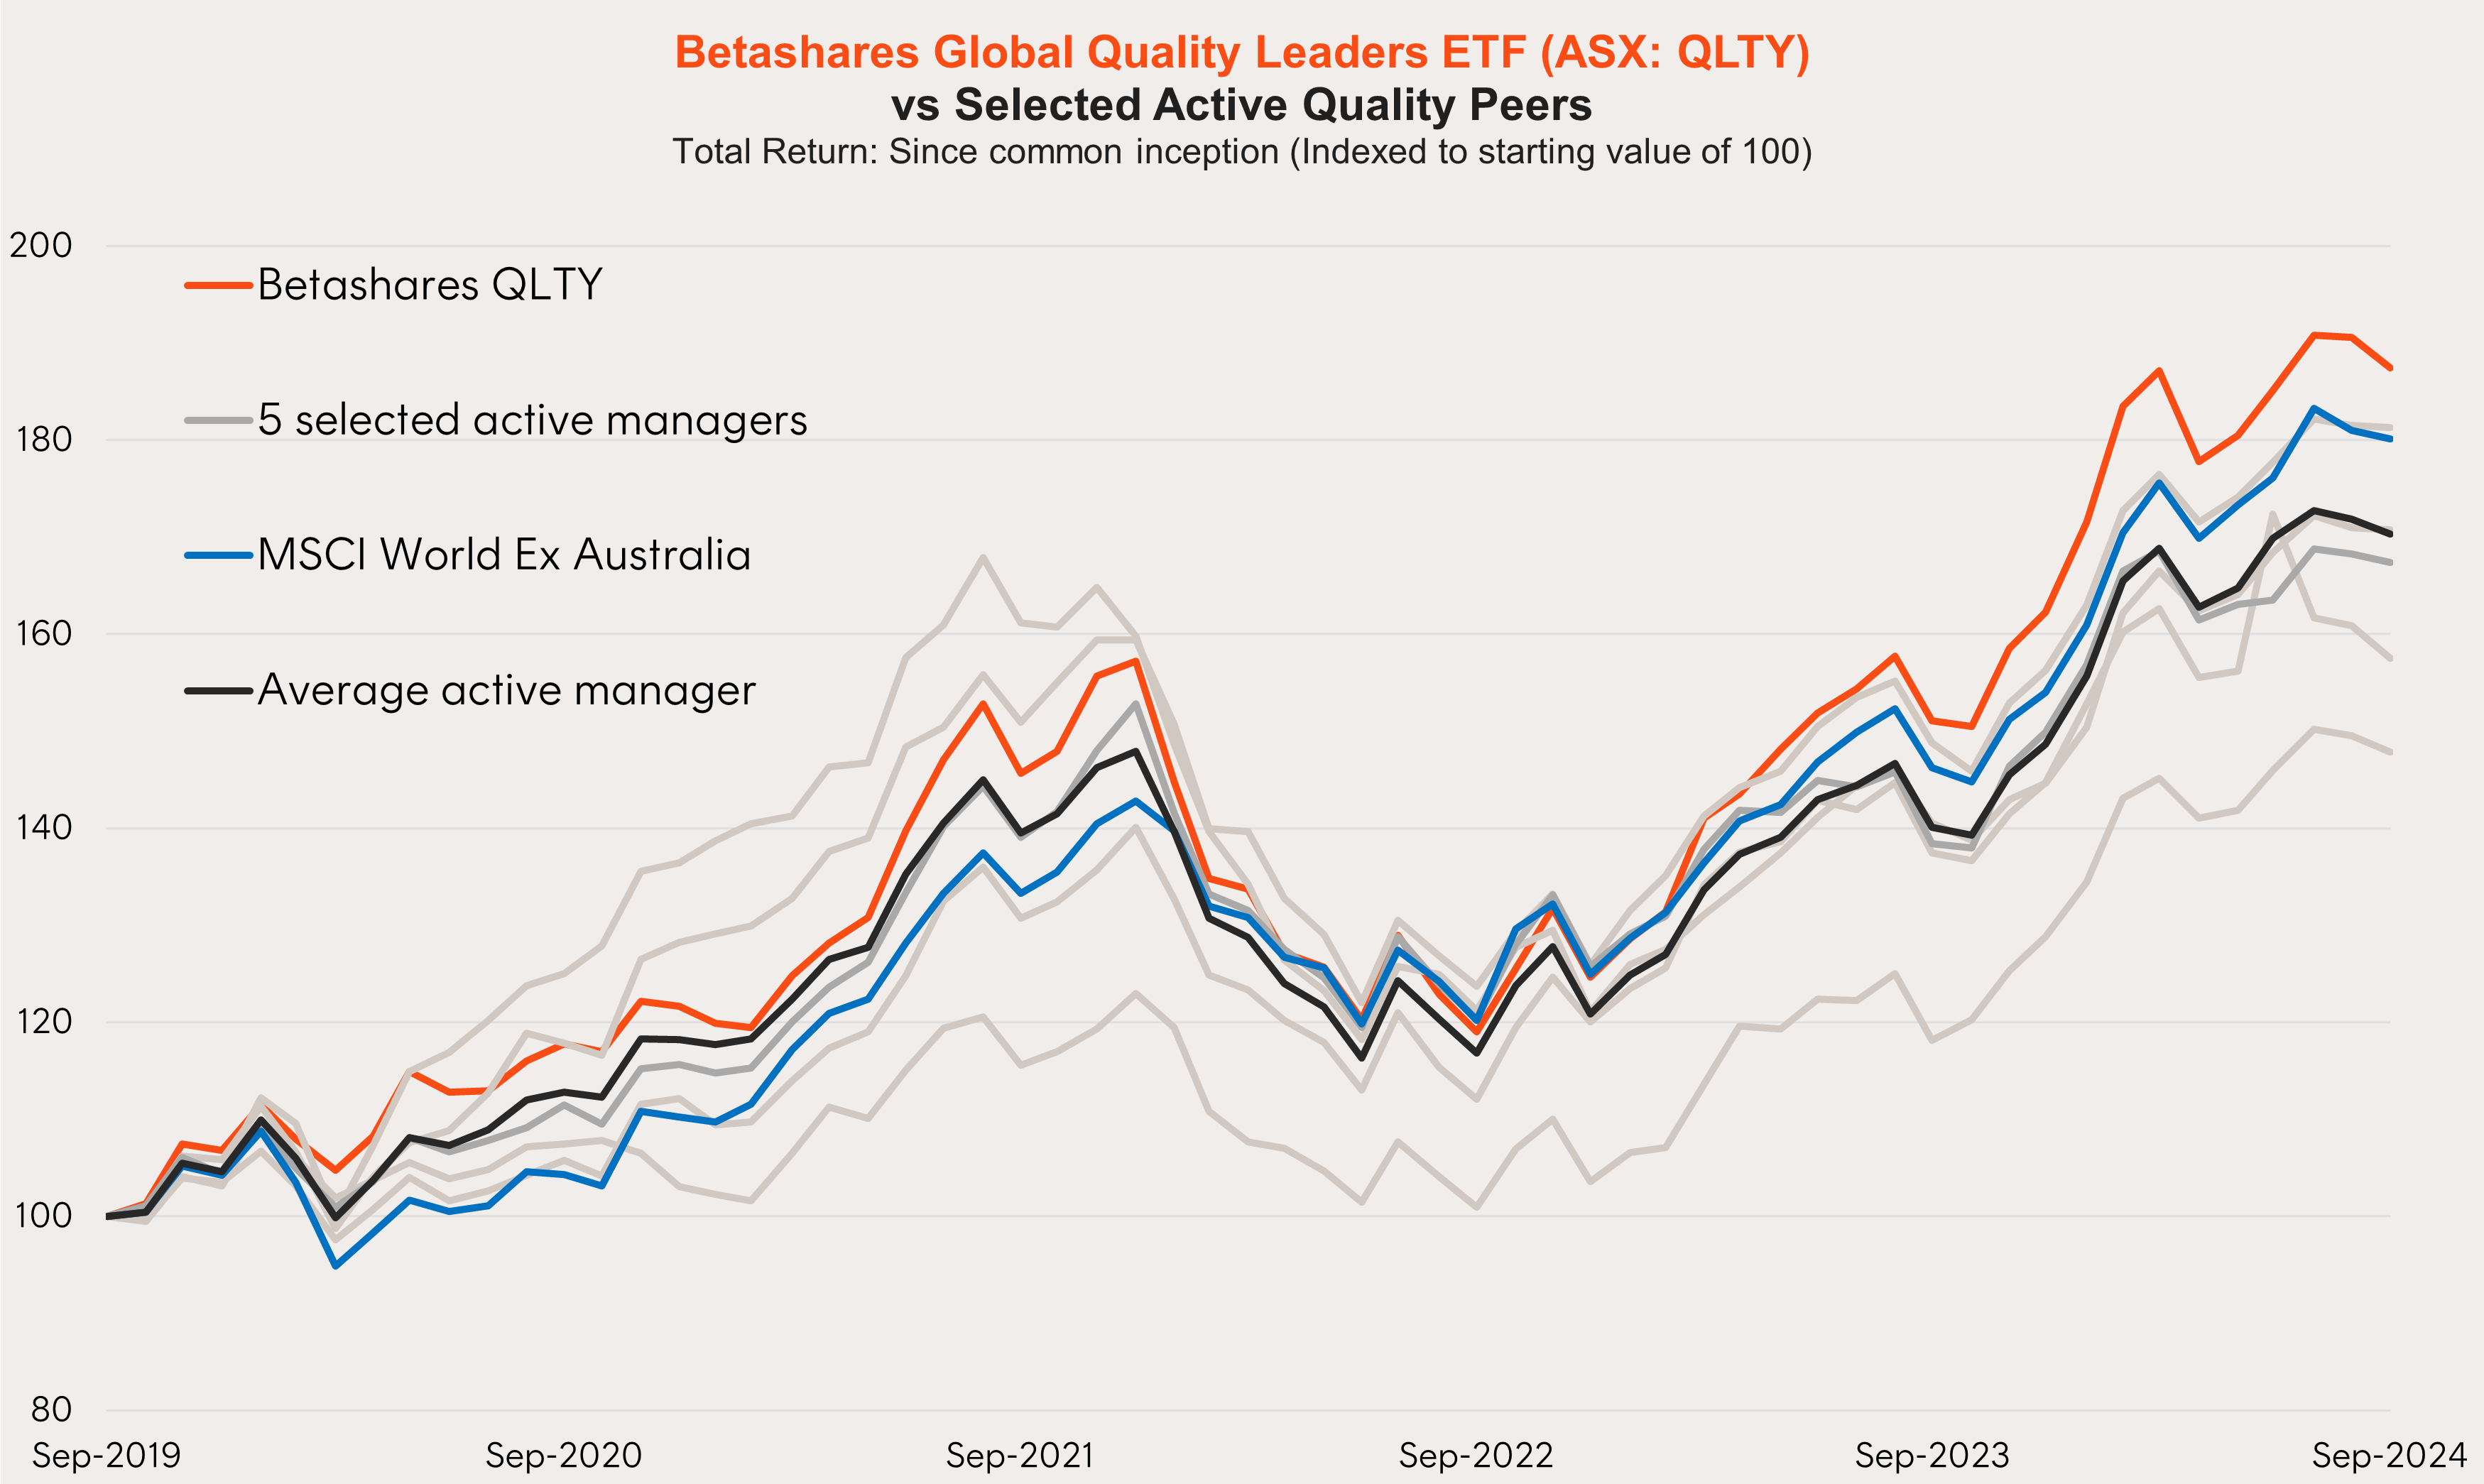
- Over longer investment time horizons, rules-based factor index ETFs have tended to outperform the majority of active funds with the same factor or style bias on a net-of-fee basis2.
Betashares Global Quality Leaders ETF (ASX: QLTY) vs Selected Active Quality Peers

Source: Morningstar. As at September 2024. Total Return: Since common inception (Indexed to starting value of 100). Common inception date is 5 November 2018. Active Quality Peers selected from Australian domiciled global equity active funds with similar factor profile to QLTY (as determined by Betashares). You cannot invest directly in an index. Past performance is not indicative of future performance of any index or fund.
In addition, the systematic approach of rules-based factor index ETFs does not allow for a subjective active judgement call to allocate to cash, which would otherwise create the risk of unintentionally altering the strategic asset allocation for end investors.
Smart indexing equity ETFs to add balance to your portfolio
Betashares has a range of ETFs that offer the best of both worlds – intelligent indexing for outperformance potential beyond broad market beta and the cost effectiveness typically expected of ETFs.
These core portfolio solutions include the following global and Australian equity funds:
QLTY Global Quality Leaders ETF
Seeks to tracks an index (before fees and expenses) designed to provide diversified exposure to 150 of the world’s highest quality companies. Companies are evaluated based on four key quality characteristics designed to capture persistent, high profitability, and QLTY’s index is weighted to seek to avoid stock specific risk.
QLTY’s management cost is 0.35% p.a.*
QUS’s index is an equally-weighted portfolio of 500 leading listed US companies. The market capitalisation-weighted S&P 500 Index has recently reached levels of concentration not seen in 50 years, with the top five names representing approximately one quarter of the overall index weight3. QUS offers a potential solution to this problem with better diversification at a stock and sector level.
QUS’s management cost is 0.29% p.a.*
Aims to track an index (before fees and expenses) designed to provide exposure to 40 high quality Australian companies, while catering for the unique characteristics of the Australian equity market to provide a core quality exposure.
AQLT’s management cost is 0.35% p.a.*
QOZ FTSE RAFI Australia 200 ETF
Access a “fundamentally weighted” portfolio of 200 large Australian companies through a fund that aims to track an index (before fees and expenses) designed to capture companies’ economic importance to the Australian economy, rather than the market capitalisation of its constituents. By removing the link between stock price and weight, QOZ’s index provides an exposure which dynamically tilts to value and benefits from mean reversion in stock prices over time.
QOZ’s management cost is 0.40% p.a.*
Access investment styles without the high fees
Most active managers have continued to underperform broad market benchmarks. What is perhaps less appreciated is that certain investment styles pursued by many actively managed funds are in fact available through lower cost index funds, avoiding the need to pay high active manager fee loads.
Indeed, low-cost index-tracking funds, including broad market exposures, together with ‘smart-indexing’ exposures, can provide an excellent toolkit for building a strong core over the long term.
Build a stronger core with Betashares
Betashares core ETFs provide a range of diversified building blocks to construct robust portfolios for your clients.
Learn more about Betashares core funds here.
* Other costs, such as transaction costs, may apply. Refer to the applicable Product Disclosure Statement, available at www.betashares.com.au, for more information.
There are risks associated with an investment in each Betashares Fund. Investment value can go up and down. An investment in any Fund should only be made after considering your particular circumstances, including your tolerance for risk. For more information on the risks and other features of a Fund, please see the relevant Product Disclosure Statement and Target Market Determination, available at www.betashares.com.au.
This information is for the use of financial advisers and other wholesale clients only. It must not be distributed to retail clients.
References:1.For example, as at 30 June 2023, Financials and Material made up 53% of the Solactive Australia 200 Index. Source: Bloomberg.2. Based on a comparative analysis undertaken by Betashares of the performance of selected “quality” and “value” active funds to Betashares funds which track an index of the same factor over a five-year period to 30 June 20233.Source: S&P Dow Jones Indices, as at 30 June 2023.
