4 minutes reading time
Reading time: 3 minutes
SEPTEMBER 2021: ETF INVESTORS ‘BUY THE DIP’ WITH HIGHEST NET INFLOWS ON RECORD
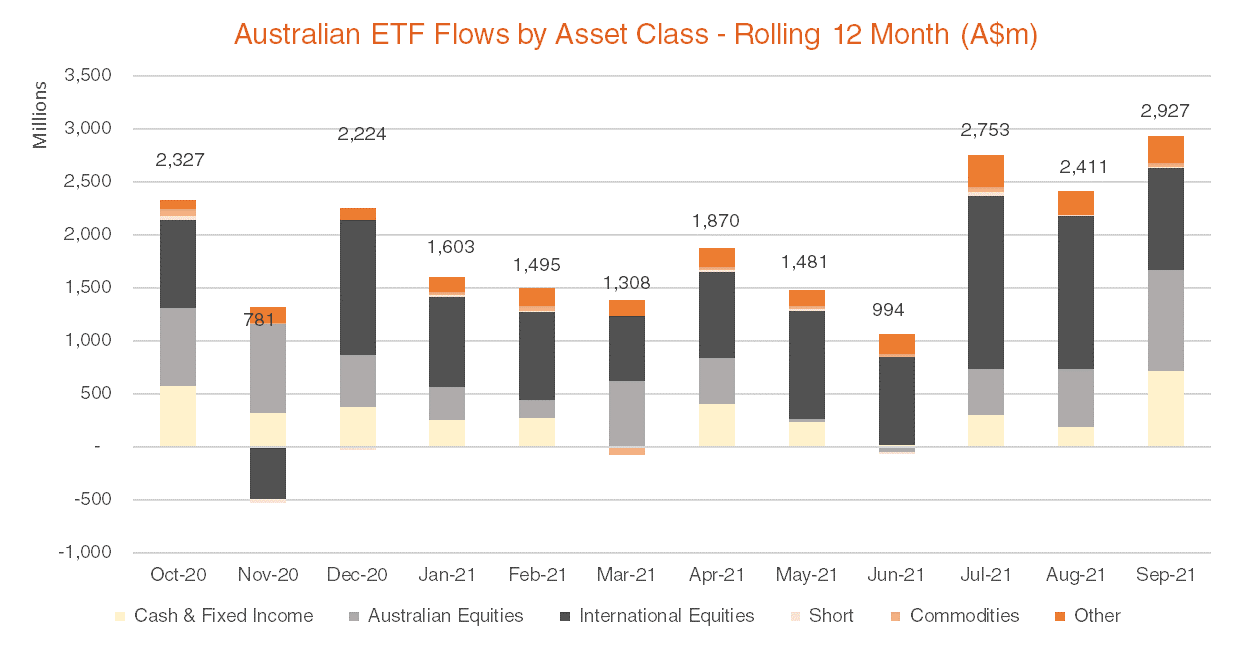
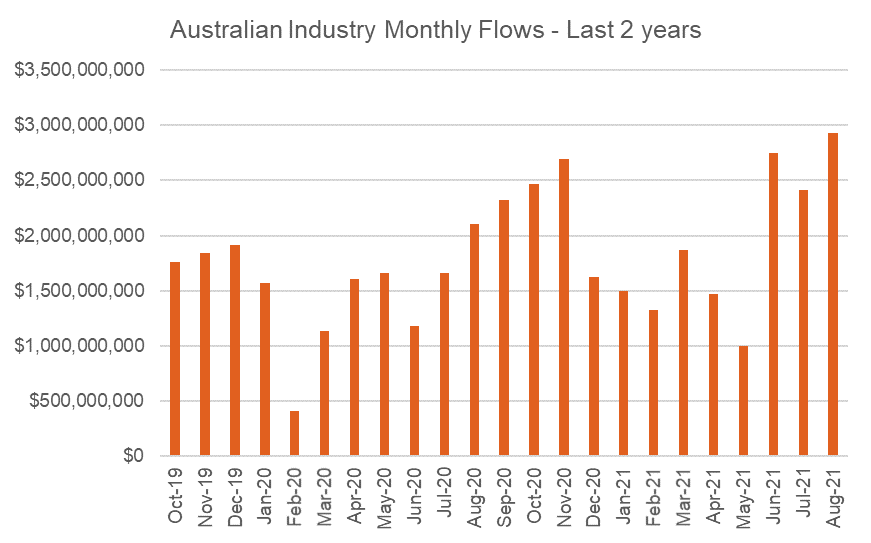
In a month where both global and Australian equities fell, ETF investors ‘bought the dip’ leading to the highest monthly net inflows on record for the industry ($2.9B). This inflow level broke the previous record set in July ($2.7B) and illustrates the increasing adoption of ETFs by investors in both rising and falling markets. September also saw a fresh record in terms of monthly net inflows by issuer, with BetaShares recording an all-time monthly record for the industry of $1.14B (beating the previous record, held by Vanguard, of $1.05B). Read on for more details, including best performers, asset flow categories and more.
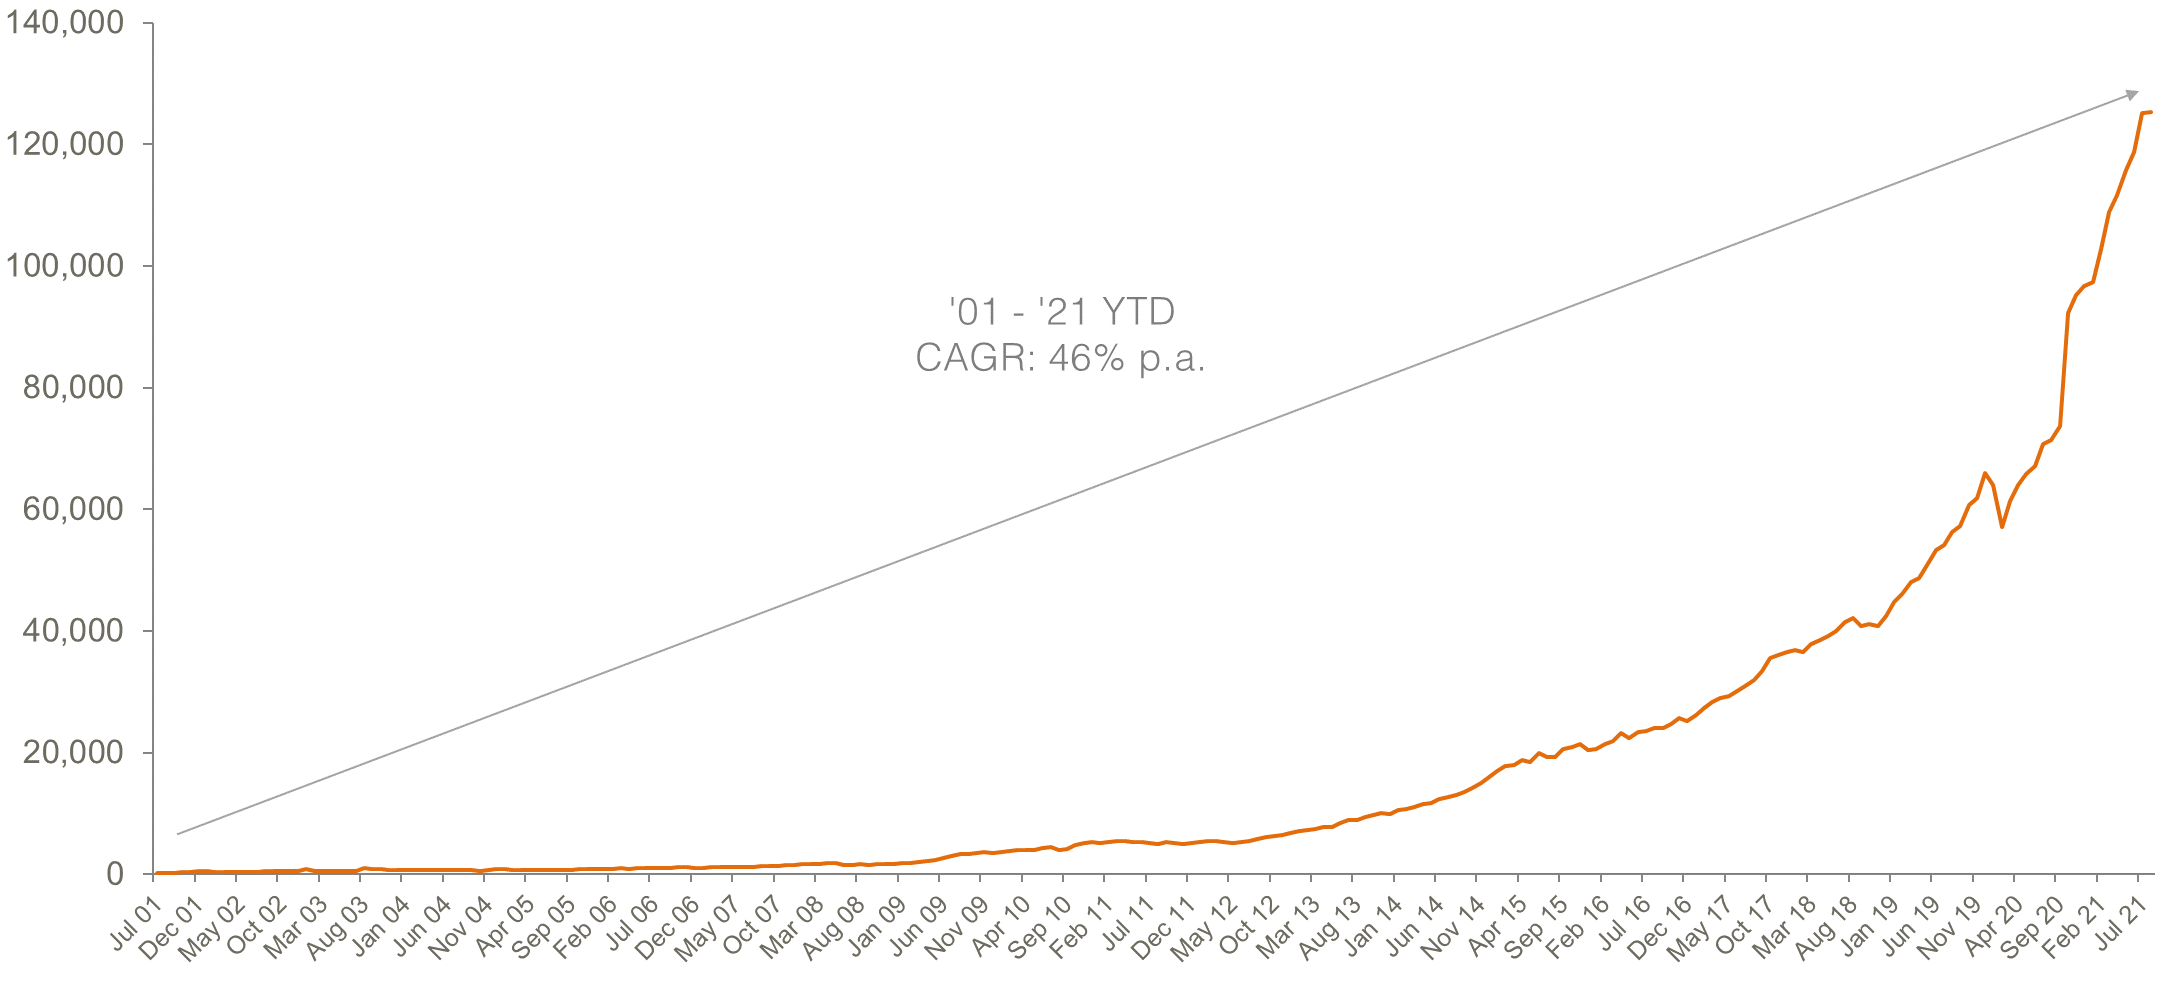
Australian ETP Market Cap: August 2001 – September 2021
Source: ASX, Chi-X, BetaShares.
Market cap
- ASX Exchange Traded Product market cap: $125.3B1 – all time end-of-month high
- Market cap change for month: 0.13%, $0.2B
- Market cap growth for the last 12 months: 75.5%, + $53.9B
Comment: The industry ended September 2021 at a fresh all-time high of $125.3B total market cap, with total industry growth of $200m for the month. Industry growth over the last 12 months has been 75.5%, for a total of $53.9B net growth over this period.
1. Includes total FuM for ETFs trading on both ASX and Chi-X
New money
- Net new money for month (units outstanding by $ value): +$2.9B – all time high monthly net inflows
Comment: Net flows into the industry were $2.4B, the third highest monthly inflows on record (after last month’s all time record of $2.7B).
Products
- 268 Exchange Traded Products trading on the ASX and Chi-X.
Comment: 1 new fund was launched this month, a new Active ETF focused on global sustainable companies. We also saw 1 single bond exposure mature.
Trading value
- ASX ETF trading value increased ~4% vs. the previous month with trading value the highest it has been since March 2020.
Comment: Monthly trading value remained high, increasing 4% month on month, with over $9B of trading activity recorded on the ASX for the month.
Performance
- Best return performance this month came from geared short exposures over U.S. equities including the Nasdaq, such as our BBUS fund (11% performance), followed by Energy exposures, including OOO (9.8%) and FUEL (7.7%).

Top 5 category inflows (by $) – September 2021
| Category | Inflow Value |
| International Equities | $963,600,471 |
| Australian Equities | $949,587,033 |
| Cash | $382,743,327 |
| Fixed Income | $333,550,941 |
| Multi-Asset | $200,646,341 |
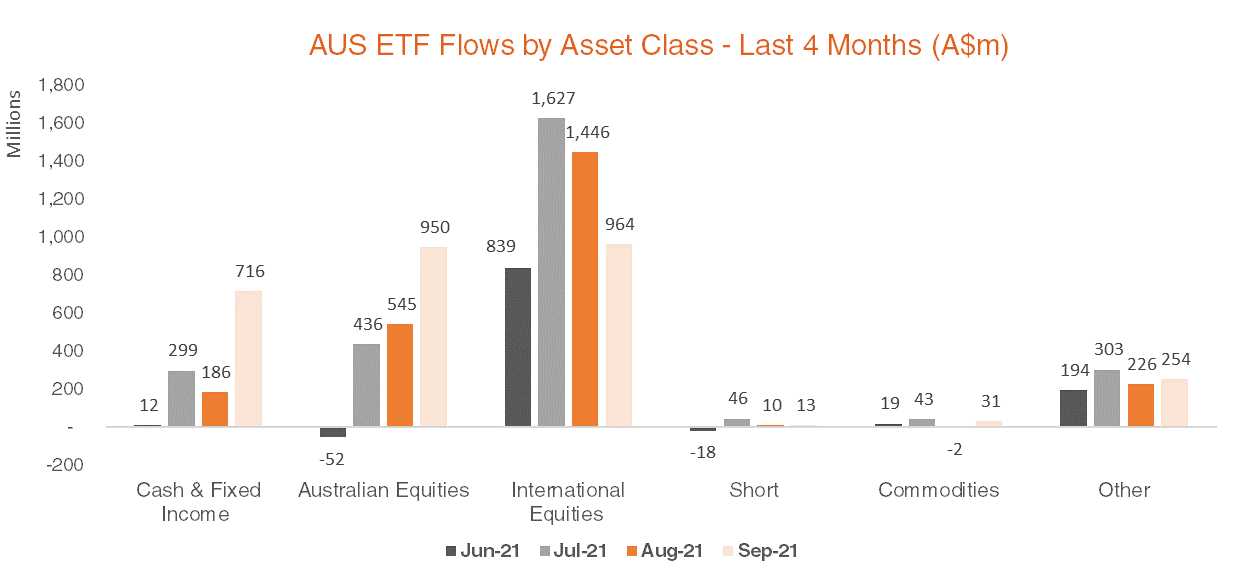
Comment: The flows this month were decidedly more mixed than the pattern observed in the year so far, with Australian and International equities receiving approximately the same amount of flow ($950m and $963m respectively). We also saw a return to meaningful flows into Cash ($382m) and Fixed Income ($333m). The compositions of the industry’s flows illustrates the extent to which ETFs are able to help investors diversify their portfolios across all major asset classes.

Source: Bloomberg, BetaShares.
Top sub-category inflows (by $) – September 2021
| Sub-Category | Inflow Value |
| Australian Equities – Broad | $788,228,760 |
| Cash | $382,743,327 |
| International Equities – Sector | $286,441,780 |
| Australian Bonds | $239,729,891 |
| International Equities – Developed World | $237,361,199 |
Top sub-category outflows (by $) – September 2021
| Sub-Category | Outflow Value |
| Australian Equities – Sector | ($13,967,594) |
| Australian Equities – Small Cap | ($12,214,504) |
| Oil | ($8,676,600) |


