3 ways to boost your investment income
3 minutes reading time
Reading time: 3 minutes
AUGUST 2021: THE EQUITIES PARTY CONTINUES, AS THE INDUSTRY REACHES NEW HIGHS
The Australian ETF industry passed a significant new milestone in August and is now over $125B in funds under management, as the ‘triple threat’ of sharemarket gains, robust inflows and active ETF conversions led to rapid growth for the month. Read on for more details, including best performers, asset flow categories and more.
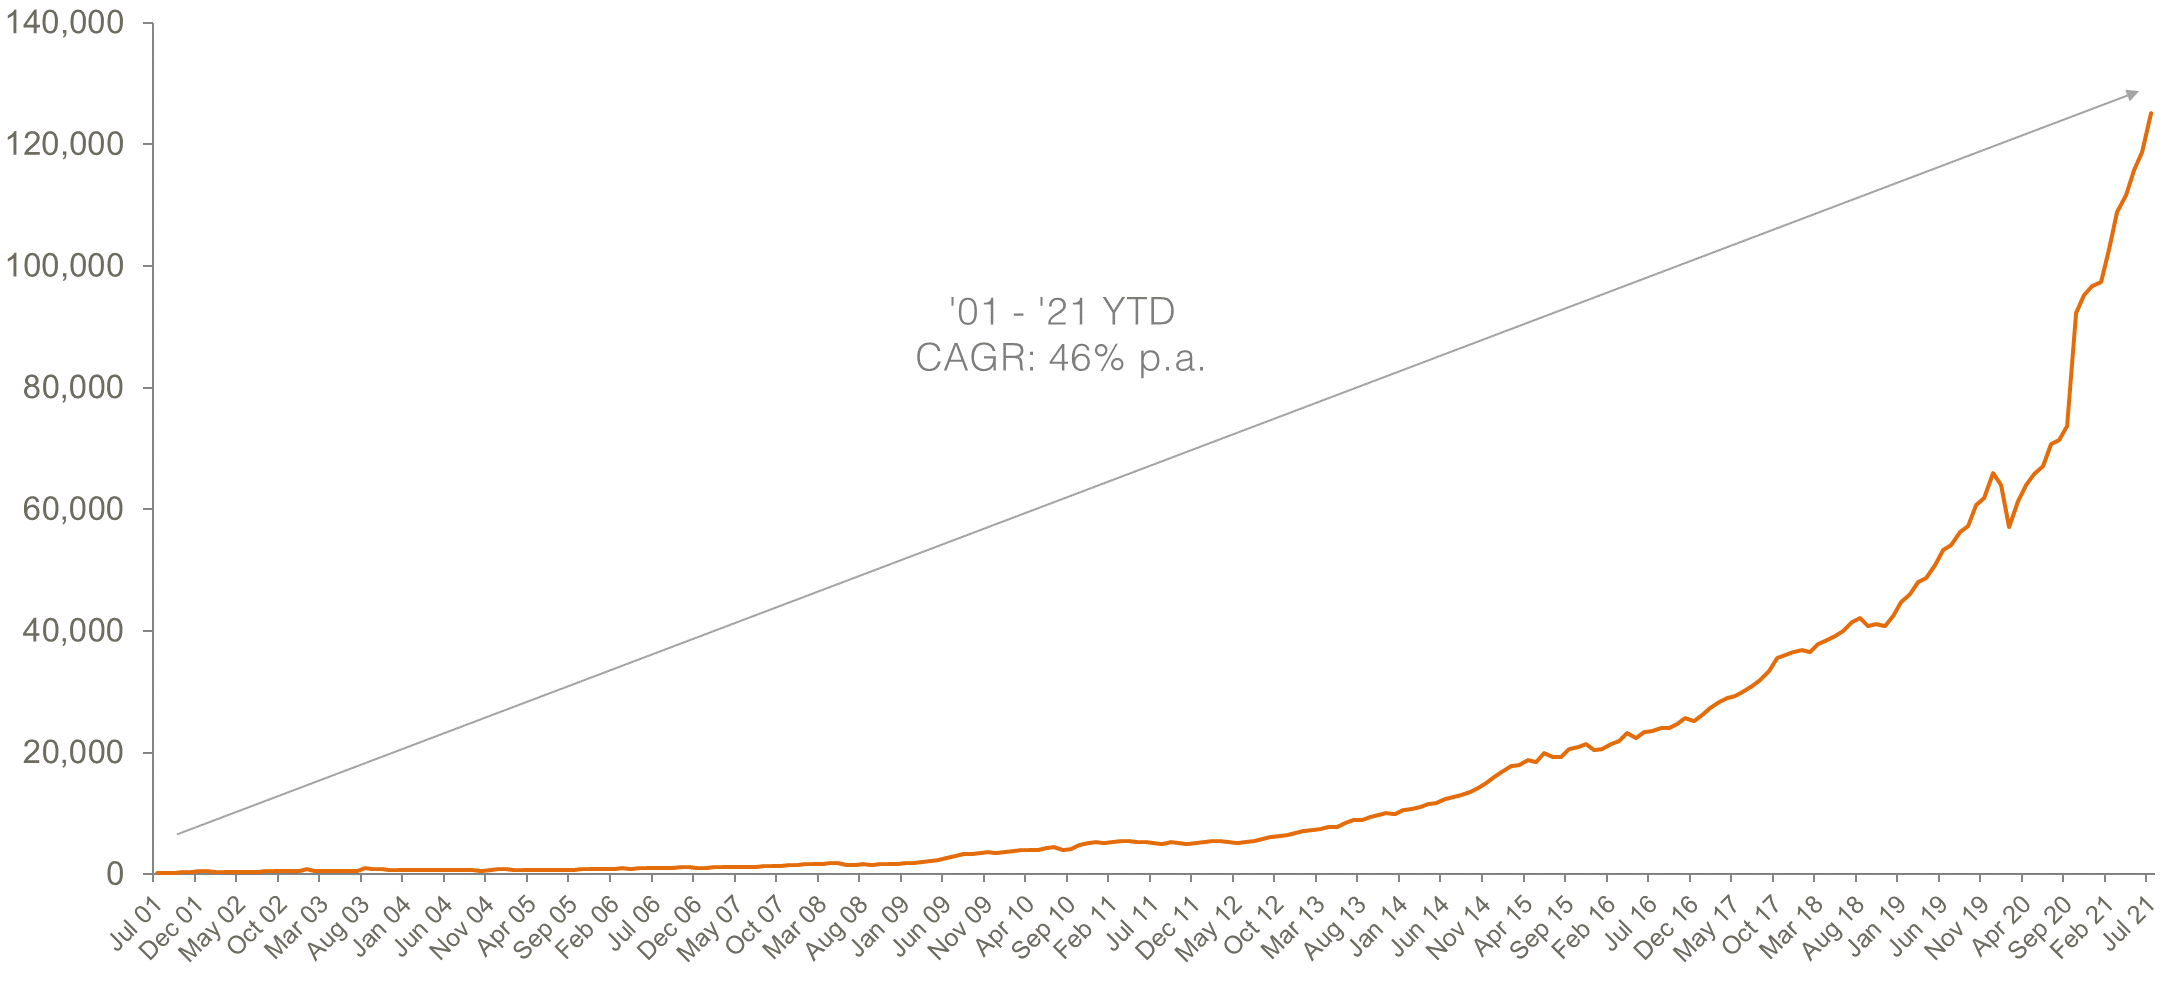
Australian ETP Market Cap: August 2001 – August 2021
Source: ASX, Chi-X, BetaShares.
Market cap
- ASX Exchange Traded Product market cap: $125.1B1 – all time end-of-month high
- Market cap change for month: 5.3%, $6.3B
- Market cap growth for the last 12 months: 76.9%, + $54.4B – fastest yearly growth ($ terms) on record
Comment: The industry ended August 2021 at a fresh all-time high of $125.1B total market cap, growing by ~5.3% month on month (+$6.3B). Industry growth over the last 12 months has been 77%, representing absolute growth of $54.4B over this period – the highest $ value increase over 12 months in the industry’s history.
1. Includes total FuM for ETFs trading on both ASX and Chi-X
New money
- Net new money for month (units outstanding by $ value): +$2.4B
Comment: Net flows into the industry were $2.4B, the third highest monthly inflows on record (after last month’s all time record of $2.7B).
Products
- 268 Exchange Traded Products trading on the ASX and Chi-X.
Comment: 3 new funds were launched this month – 2 new active ETFs (Magellan’s conversion and a new global income product) and 1 new semiconductor-focused exposure. We also saw an issuer leave the industry this month, with 360 Capital closing its Active Value ETF as part of the organisation’s broader retreat out of listed equities.
Trading value
- ASX ETF trading value increased ~11% vs. the previous month >$9B traded for the month.
Comment: Monthly trading value remained high, increasing 11% month on month, with over $9B of trading activity recorded on the ASX for the month.
Performance
- Best performance this month was our Australian Technology ETF (ASX: ATEC) (14%) followed by Indian Equities and Technology Equities exposures.
Top 5 category inflows (by $) – August 2021
| Category | Inflow Value |
| International Equities | $1,445,638,501 |
| Australian Equities | $544,683,179 |
| Multi-Asset | $171,712,992 |
| Fixed Income | $167,561,427 |
| Listed Property | $53,035,000 |
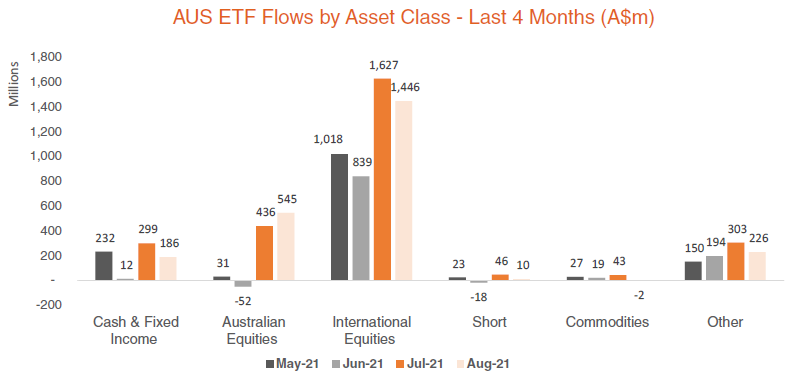
Comment: Equities continue to dominate flows as they have done throughout the year – this month equity ETF inflows represented ~85% of total flows. International equities products in particular continue to drive the majority of industry growth, with over $1.4B of assets flowing into this category and another $544m flowing into Australian equities this month.
Top 5 category outflows (by $) – August 2021
| Category | Inflow Value |
| Commodities | ($1,581,665) |

Source: Bloomberg, BetaShares.
Top sub-category inflows (by $) – August 2021
| Sub-Category | Inflow Value |
| International Equities – Developed World | $686,958,606 |
| International Equities – Broad | $395,576,685 |
| International Equities – Sector | $216,173,392 |
| International Equities – US | $184,685,466 |
| Multi-Asset | $171,712,992 |
Top sub-category outflows (by $) – August 2021
| Sub-Category | Outflow Value |
| Oil | ($5,943,674) |


![[Infographic] 20 years of ETFs on the ASX](https://www.betashares.com.au/wp-content/uploads/2022/09/twenty_balloons_640x360.jpg)
