Why more income could be made from this Aussie asset class
7 minutes reading time
- Australian shares
When it comes to Australian equities, there have been two themes that have consistently been a feature of my conversations with clients, being (1) the desire for equity income and (2) how smart beta may play a role in place of high-cost active managers.
1 – Australian investors love equity income
Australian investors love income. Particularly income from the domestic equities sleeve of our portfolios. Research has shown this plays a part in why Australia has the largest ‘home country bias’ globally. Home country bias refers to investors’ tendency to have a higher portion of their investments in their domestic market.
The Australian equity market’s dividend yield has consistently been the highest among the world . This is due in large part to the dividend imputation system introduced in the 1980s, which helped improve tax efficiency for Australian shareholders. Taxes paid at the corporate level could now be passed through to Australian investors as franking credits attached to dividends – making Australian shares more attractive. The chart below as at 30 June 2023 shows the Australian market’s higher cash dividend yield relative to other global equity markets, even before franking credits are factored in.
Chart 1: Trailing 12-month cash dividend yield amongst major developed countries

Source: Bloomberg. As at June 30 2023. Markets represented in order: S&P/ASX 200, FTSE 100, Euro Stoxx 600, A&P/TSX, Topix, S&P 500. You cannot invest directly in an index. Past performance is not an indicator of future performance.
2 – Smart beta investing as a substitute for active
The second theme has been increasing interest in smart beta investing. Traditional indices use market capitalisation, or the size of a company, to determine the weight it receives in the index. Conversely, smart beta indices take a more targeted approach, often selecting and weighting companies based on fundamentals with the aim of targeting an investment factor or better investment outcomes.
Many think of smart beta indices as a marrying of passive and active investment styles. For investors, smart beta indices potentially offer the opportunity to add alpha over traditional broad market indices (historically thought of as the role of active managers) while remaining rules-based, transparent, and low-cost.
Chart 2: Growth of smart beta ETFs in Australia

Source: ASX, CBOE, Betashares. As at 31 August 2023.
Squeezing more out of the Australian equity market
With these two themes in mind, Betashares QOZ FTSE RAFI Australia 200 ETF stands out. QOZ aims to track a smart beta index. The index selects and weights securities in a rules-based manner, preferencing those in the Australian market that have strong fundamentals such as sales, cash flow, dividends, and book value. The aim is to reflect each company’s overall economic importance rather than market sentiment. Since it’s inception QOZ has outperformed the S&P/ASX 200 over the time periods shown in the table below as at 29 September 2023.
Chart 3: FTSE RAFI Australia 200 Index v S&P/ASX 200 Index performance: As at 29 September 2023

Source: Betashares. As at 29 September 2023. Past performance is not an indicator of future performance. Returns are calculated in Australian dollars using net asset value per unit at the start and end of the specified period and do not reflect brokerage or the bid ask spread that investors incur when buying and selling units on the ASX. Returns are after fund management costs, assume reinvestment of any distributions and do not take into account tax paid as an investor in the Fund. Returns for periods longer than one year are annualised. Current performance may be higher or lower than the performance shown.
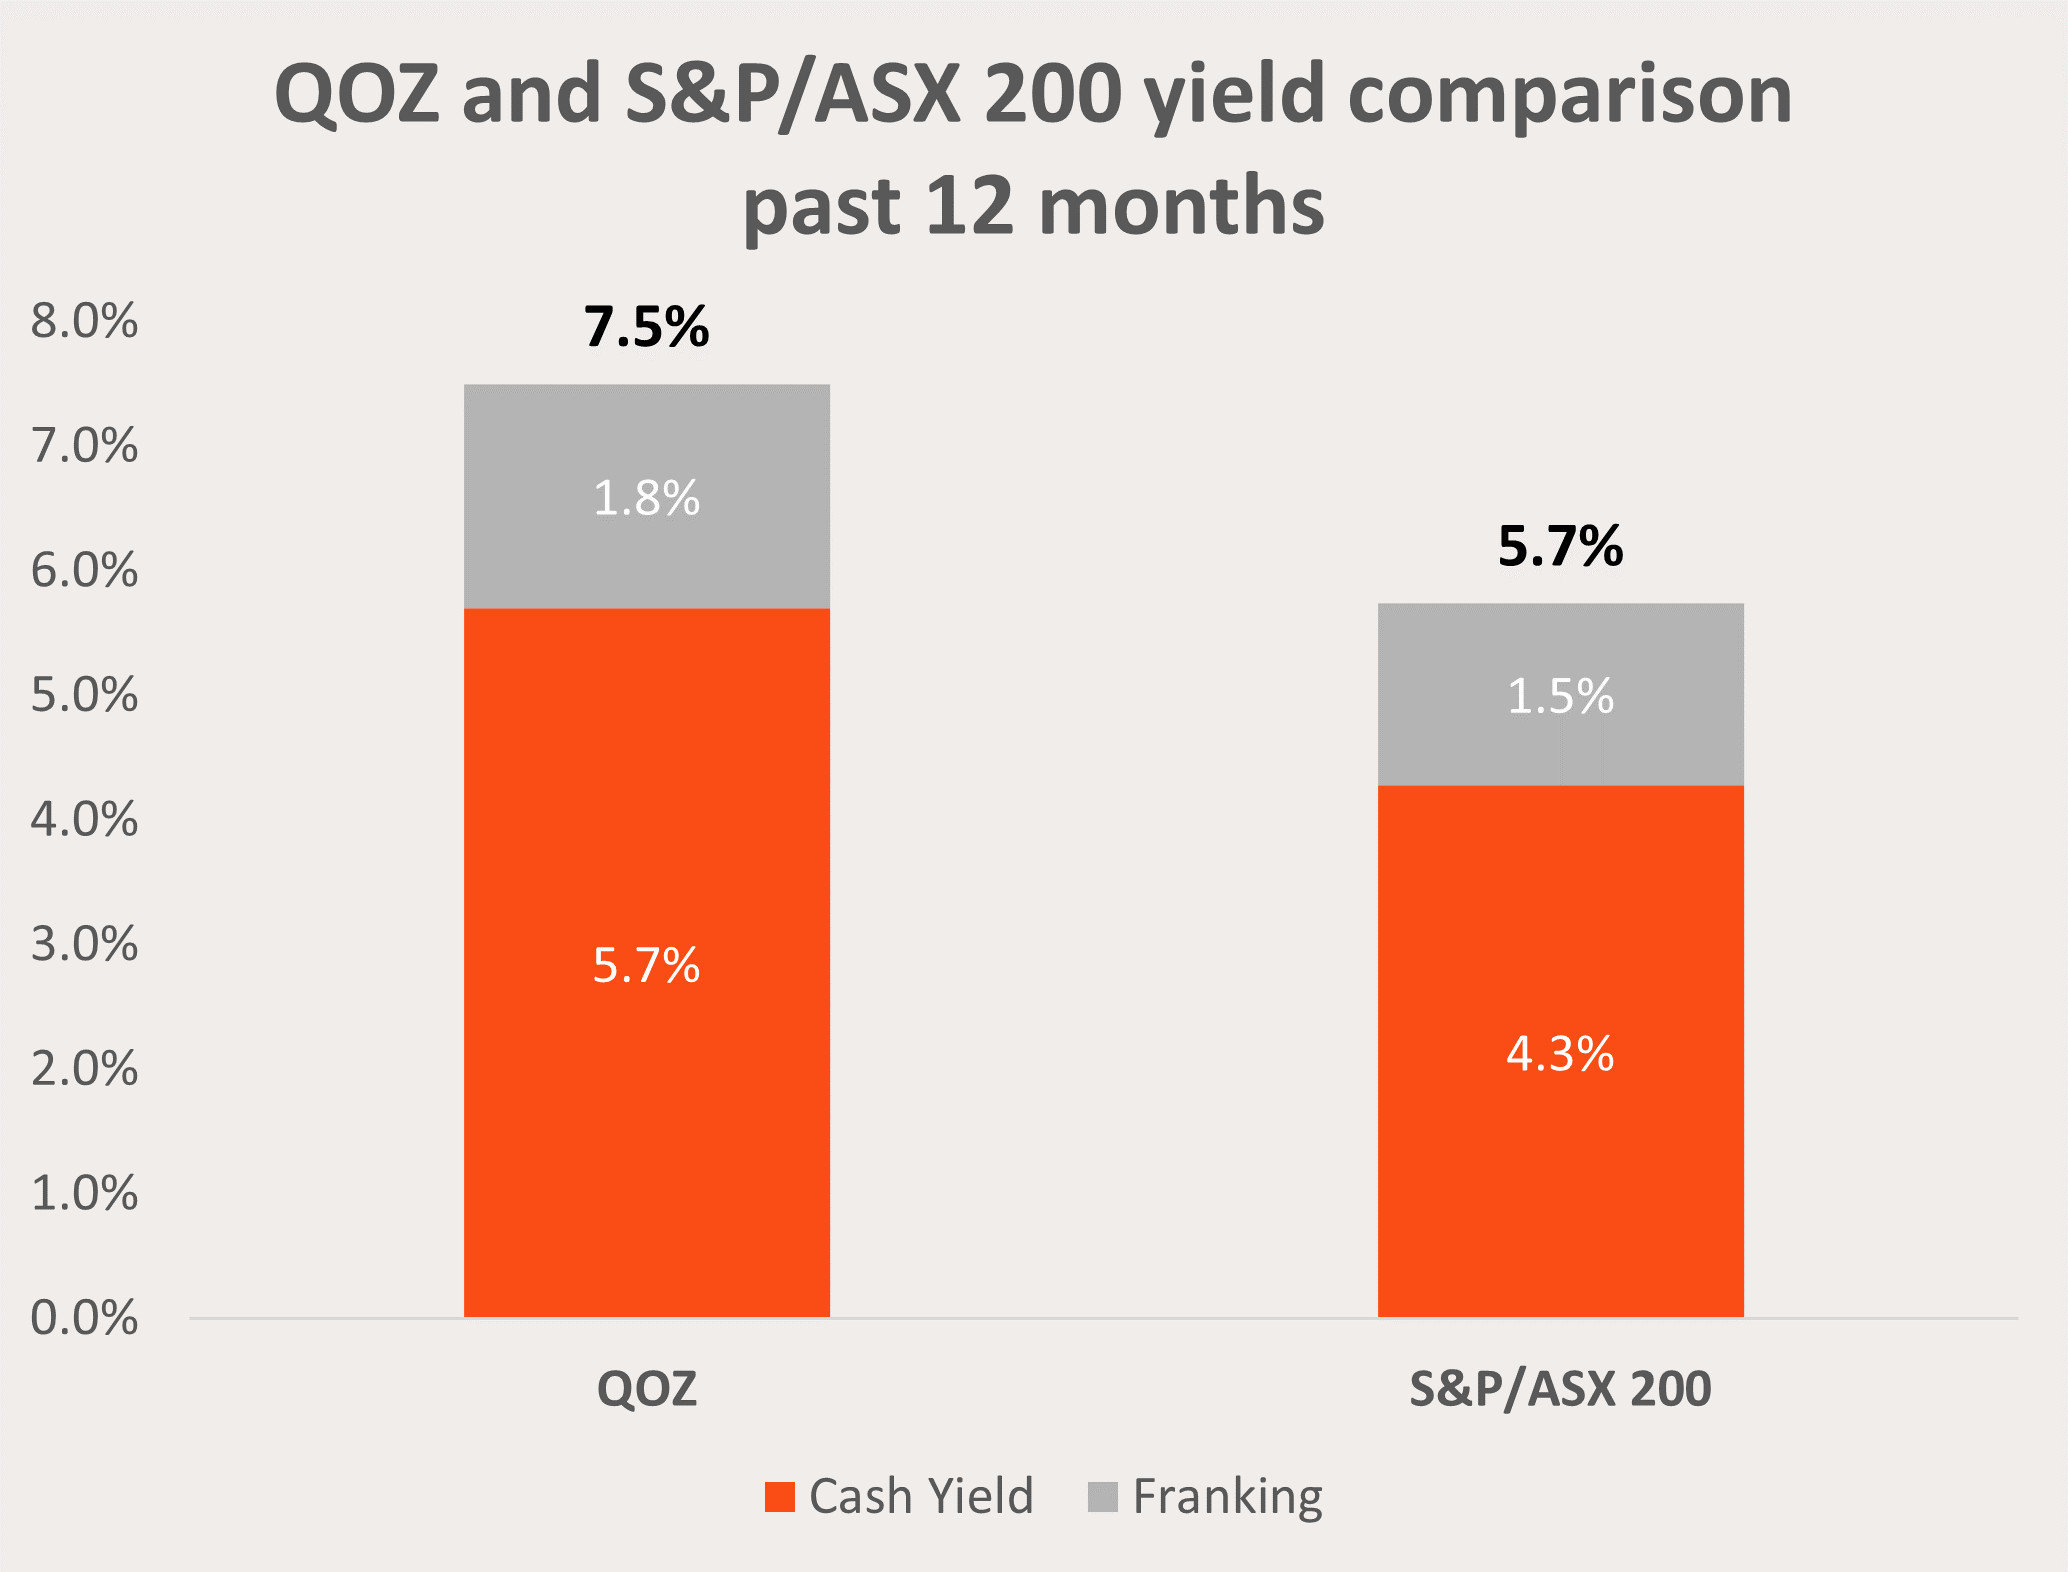
Importantly for Australian investors, QOZ’s preference for companies consistently paying high dividends has led to more of these returns coming through franked distributions.
Chart 4: Net and gross yields of QOZ and the S&P/ASX 200 Index: As at 29 September 2023

*As at 29 September 2023. Yield is calculated by summing the prior 12-month per unit distributions divided by the closing NAV per unit at the end of the relevant period. Yield will vary and may be lower at time of investment. Franking level is total franking level over the last 12 months. Not all Australian investors will be able to receive the full value of franking credits. Past performance is not indicative of future performance.
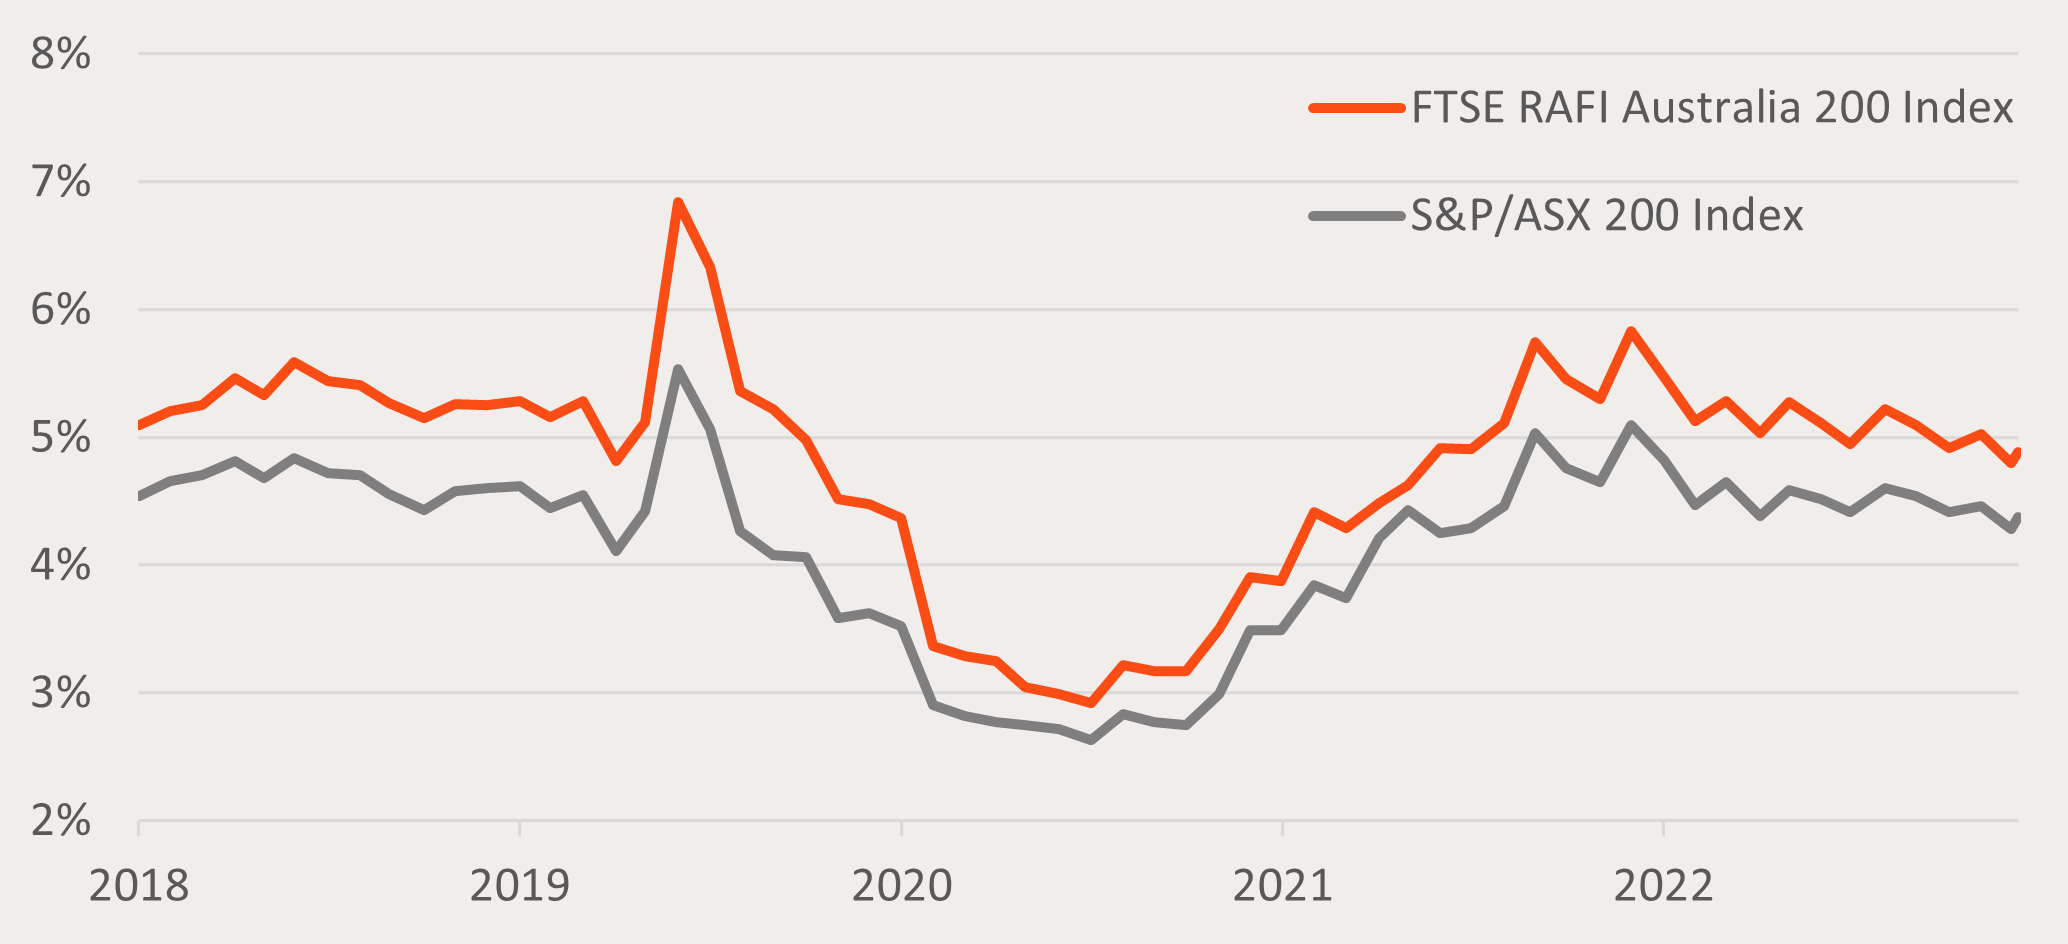
And this higher distribution yield has been a trend for the underlying smart beta index QOZ aims to track – hardly surprising given dividend yield is one of the metrics used to select and weight companies in the index.
Chart 5: Betashares QOZ’s Index and S&P/ASX 200 Index net yield: 5 years to 29 September 2023

Source: Bloomberg. You cannot invest directly in an index. Yield will vary and may be lower at time of investment. Past performance is not an indicator of future performance. QOZ index’s yield does not take into account QOZ’s management fee and costs of 0.40%p.a.
For investors assessing the allocations in the core of their Australian equities portfolios, preferencing franked income for returns, and looking to harness the benefits of smart beta investing QOZ could be a solution.
I also wrote another piece on QOZ in August further exploring its methodology and in particular the underlying index’s potential to generate alpha over time by buying high and selling low. You can read that piece here.
You can find more information on QOZ at its fund page here.
QOZ is rated ‘Recommended’ by Lonsec. You can request the research reports from your Betashares account manager or by filling in the form under the following link.
For more information on Betashares ETFs’ platform availability please use the following link.


