6 minutes reading time
Financial adviser use only. Not for distribution to retail clients.
With the Fed officially starting its easing cycle with an outsized 50 basis point cut, there’s a reasonable case to be made that the recent run of broad USD weakness will continue, supporting the AUD/USD exchange (or ‘pair’). In addition to the favourable macro backdrop, we also have a bullish technical setup for the AUD/USD pair, which is already showing clear momentum and technical strength and is on the verge of closing above the mid-2023 highs. This may see a clear run above 70 US cents and reward investors who choose to hedge their global equities exposures.
Should you currency hedge your global equities exposure? A technical view on the AUD/USD exchange rate.
The decision to currency hedge your global equities exposure generally comes down to your view on the AUD/USD exchange rate given its circa 70% exposure to the developed market stock index. Typically, a rising AUD relative to the USD is expected to benefit currency hedged exposures and vice versa.
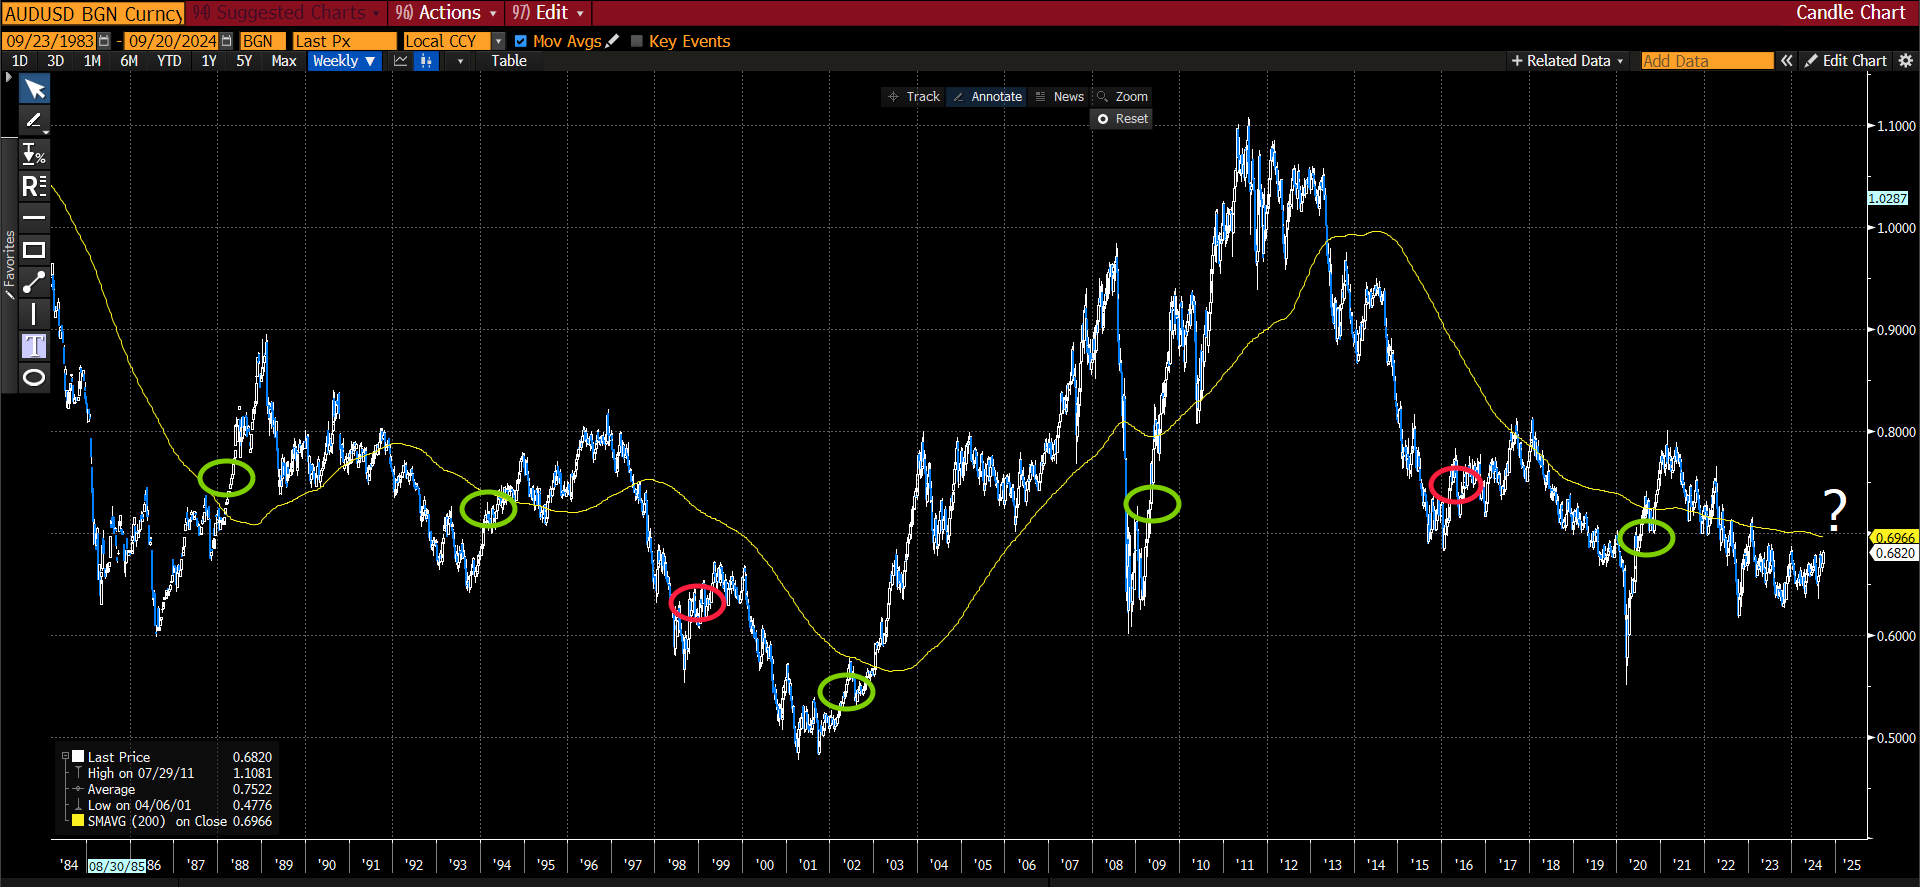
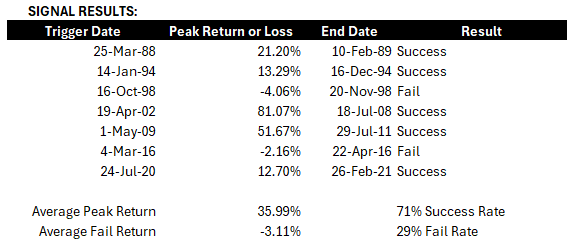
The ability to read the charts can be important in currencies. At the close of last week, we identified a technical buy signal for the AUD/USD that has only been triggered seven times previously since the AUD was floated in 1983. It’s important to note that this buy signal does not guarantee continued AUD strength, but historically the average peak return subsequent to this signal was a 36% appreciation in the AUD/USD. On two occasions the pattern failed with an average loss of only 3.1%, which implies a historical 71% probability of success as well as favourable risk return metrics.
The buy signal for the AUD/USD since 1983: With successful triggers highlighted in GREEN, fails highlighted in RED, as well as peak returns and losses shown in the table below
23 Sept 1983 to 20 Sept 2024

Source: Bloomberg.

Source: Bloomberg.
How does this buy signal work?
A buy signal in technical analysis is triggered if one or more conditions are met. Generally, the more conditions met, the higher the probability of success. In the case of this buy signal, the conditions are:
- the AUD/USD must be trading below its 200 week moving average (the yellow line in the following chart);
- a major downward sloping trendline is broken where the AUD/USD closes above that trend line (the green line); and
- the AUD/USD subsequently closes above the prior pivot high on a weekly basis (the red line).
For this particular signal to be a success, the AUD/USD pair should close above the 200 week moving average.
The most recent successful trigger: 24 July 2020 – 26 Feb 2021

Source: Bloomberg.
For illustrative purposes, we have defined the end of the signal period as a confirmation close1 below the weekly 200 moving average, in this case marked at point 4 in the chart above. Where the signal is successful AUD/USD peak return is measured from the trigger date (point 2 in the chart above) to the highest price within the signal period.
A failed signal in this case is defined as a fail to close above the 200 week moving average and the AUD/USD pair trades below the trigger level with a confirmation close i.e. a weekly close below the trigger level, followed by a weekly close below the low of that initial weekly candle. A loss occurs when the signal fails and will be measured as the return between the trigger date and the date of confirmation.
The most recent failure of the signal: 4 Mar 2016 – 22 April 2016

Source: Bloomberg.
So, what is the signal telling us right now?
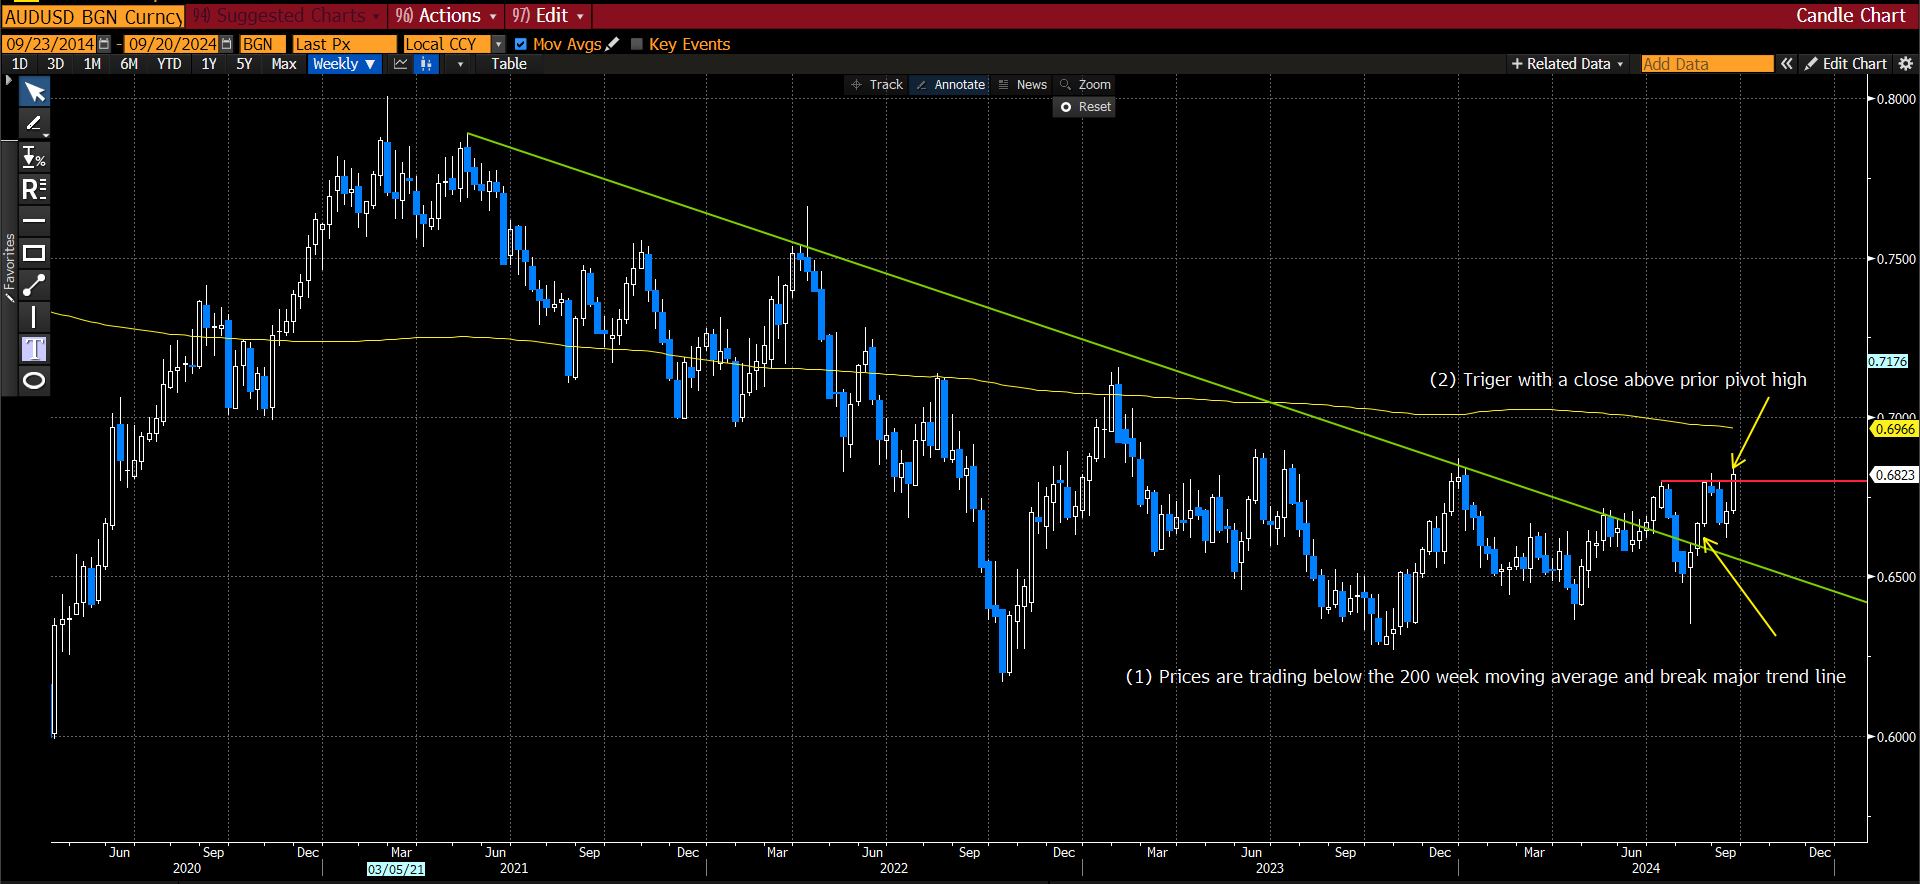
On 16 August 2024, the AUD/USD was trading below the 200-week moving average and closed above a major downward sloping trend line (green line), as shown in the chart below. Then on 20 September, there was a weekly close above the prior pivot high (red line) triggering a buy signal.

Source: Bloomberg.
In order for the signal to be a success, prices should close above the 200 week moving average which is currently around 70 US cents. A fail of this signal will require a weekly close below the prior pivot high followed by another weekly close below the low of the weekly candle (i.e. a confirmation close). Until then, the technical setup in the AUD/USD pair suggests hedging your global equities which may be the favourable position from a risk return perspective in the medium term.
What options do investors have to currency hedge portfolios?
Australian investors ultimately have the choice of being hedged or unhedged when investing in global equities.
Betashares offers the following range of currency hedged core global equity funds that are designed to be low cost and tax efficient, to improve outcomes for our investors seeking to mitigate currency risk:
- HQUS S&P 500 Equal Weight Currency Hedged ETF
- HNDQ Nasdaq 100 Currency Hedged ETF
- HGBL Global Shares Currency Hedged ETF
- HQLT Global Quality Leaders Currency Hedged ETF , and
- HETH Global Sustainability Leaders Currency Hedged ETF
You can find more information on currency hedging and Betashares’ currency hedged funds, including sector and regional funds, here.
You can find a video here to help explain currency hedging.
There are risks associated with an investment in each Fund, including market risk, index tracking risk, sector risk, security specific risk, strategy risk and, for Funds with global exposure, international investment risk, country risk and currency risk. Investment value can go up and down. An investment in each Fund should only be considered after considering your particular circumstances, including your tolerance for risk. For more information on risks and other features of each Fund, please see the Product Disclosure Statement and Target Market Determination, both available at www.betashares.com.au.
References
- A confirmation close requires an initial close below a specific level, followed by a close below the low of the initial candle. ↑
