

Back to basics: The five Ws of Private Debt

Annabelle Dickson
6 minutes reading time
Related articles

Better investing starts here
Get Betashares Direct
Betashares Direct is the new investing platform designed to help you build wealth, your way.
Scan the code to download.
Learn more
Learn more
Australia punched well above its weight at the Paris Olympics, taking home 5.5% of the total gold medals, despite accounting for just 0.33% of the global population1. In fact, only the USA, China, and Japan scored more gold medals – all countries with populations in the hundreds of millions or even billions.
But it’s not just in sports that Australia punches above its weight. Despite our small population, Australia’s economy currently accounts for around 1.67% of global GDP2, while our stock market is 1.79% of the world’s total3. Perhaps it should come as no surprise then that Australian investors have traditionally preferred to invest locally.
But in recent years, Australian investors have increasingly looked to international markets for their equity exposure, and ETFs have been a popular way to get that exposure. Data from the ASX (see chart below) shows that while in 2017 the split between investments in Australian shares ETFs and international shares ETFs was close to 50/50, today, international shares ETFs hold almost twice the assets of Australian shares ETFs.
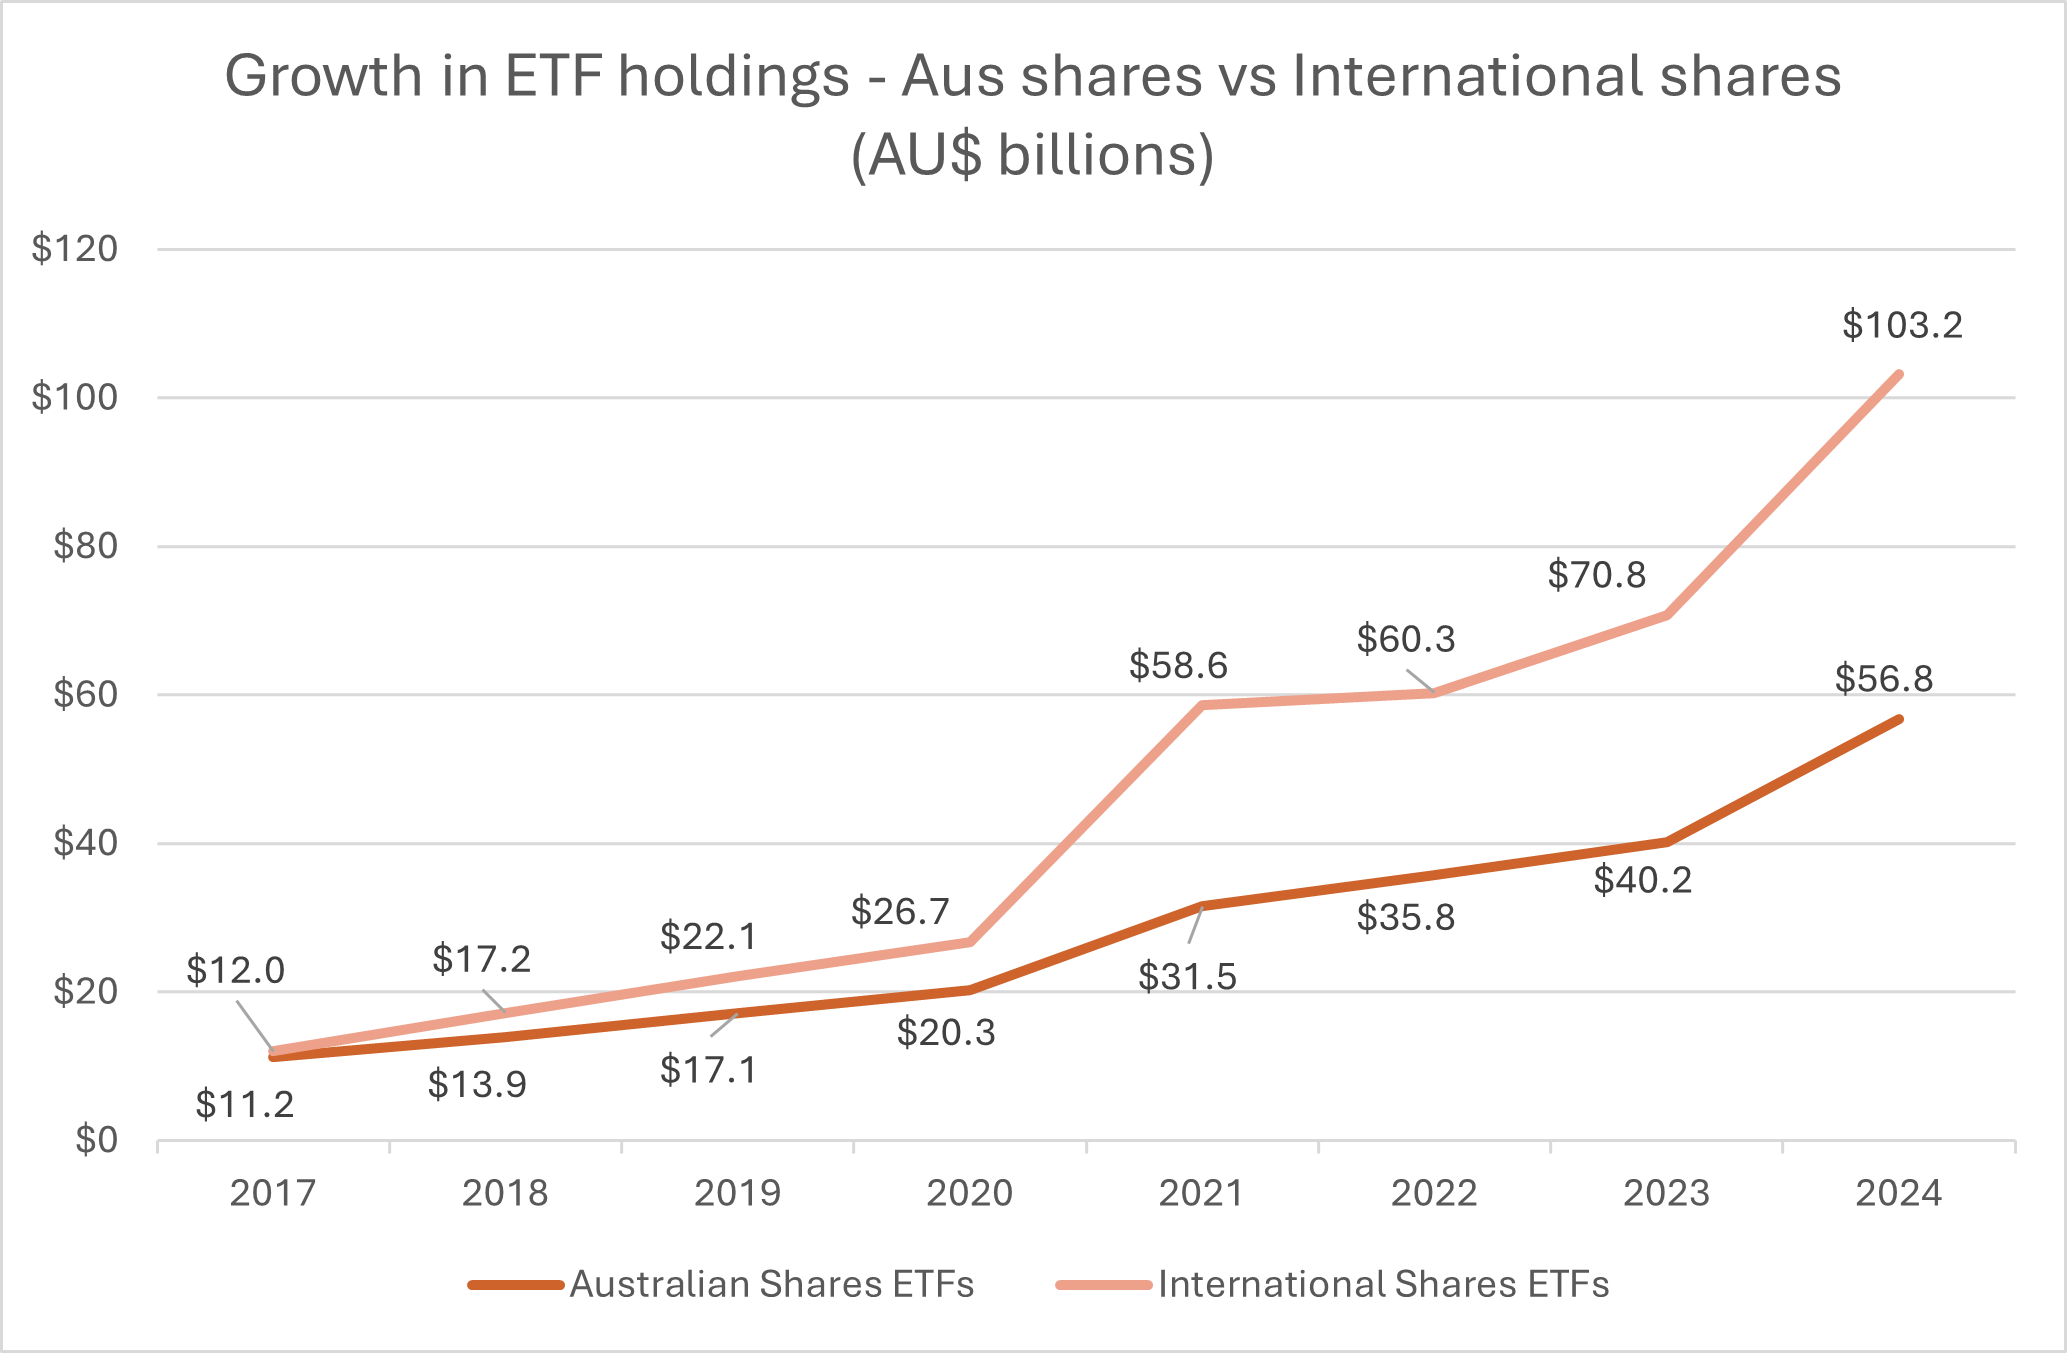
Source: ASX Investment Products monthly update, Betashares analysis. As at 31 July 2024. Based on July data of each year. Based on ASX classifications, Australian shares ETFs includes ‘Equity – Australia’, ‘Equity – Australia Small/Mid Cap’, ‘Equity – Australia Sectors’, and ‘Equity – Australia Strategy’. International Shares ETFs includes ‘Equity – Global’, ‘Equity – Asia’, ‘Equity – EM’, ‘Equity – Global Sectors’, and ‘Equity – Global Strategy’.
So for those considering diversifying overseas, here are three potential approaches to setting country allocations.
The Globetrotter
Given Australia accounts for just under 2% of global stock markets, some investors may be looking to allocate a significant part of their portfolio to international stocks. This approach may be considered by investors looking to achieve an equity allocation that more closely represents the breakdown of global markets.
BGBL Global Shares ETF offers a simple, low-cost way to achieve that goal. BGBL provides access to around 1,500 companies from more than 20 developed markets, and for a management cost of just 0.08% p.a4. BGBL excludes companies listed in Australia, which can help to ensure that your domestic and foreign equity exposures don’t overlap.
Alternatively, NDQ Nasdaq 100 ETF provides exposure to 100 of the largest non-financial companies listed on the Nasdaq stock exchange. While the Nasdaq is a US exchange, when you look through to where the companies in the Nasdaq 100 Index generate their revenues, the Index offers what can be considered as a global exposure5.
As both NDQ and BGBL exclude Australian listed companies, a low-cost, broad-market exposure to Australian companies, such as A200 Australia 200 ETF , can help fill that gap in your portfolio.
The Income-Seeker
Income-seeking investors have tended to shun international shares, preferring instead to stick with the high dividend yields and franking credits available from Australian shares. But with the wide range of income-focused products available on the ASX, investors may consider diversifying overseas while still obtaining an attractive income from their equity allocation.
INCM S&P Global High Dividend Aristocrats ETF selects high-yielding global companies and pays distributions quarterly. The portfolio currently includes well known global companies such as Citigroup, IBM, AT&T, and Kellogg6. INCM’s historical 12-month distribution yield was 4.6% as at 31 July 20247.
Of course, one of the big reasons Australian income investors like to invest locally is the prospect of franking credits. HVST Australian Dividend Harvester Active ETF follows a rules-based strategy to ‘harvest’ dividends, taking franking credits into account when aiming to maximise exposure to dividend-paying Australian shares. Depending on their circumstances, investors may consider combining HVST with INCM in order to achieve global diversification while potentially benefiting from franking credits. HVST’s 12-month distribution yield was 6% as at 31 July 2024, with the 12-month gross distribution yield at 8.1%, with a franking level of 78.4%8.
One consideration in implementing such a strategy is that it may leave you with a sector allocation that skews towards financials, which often pay attractive income, and away from technology, where businesses tend to reinvest for growth rather than paying high dividends. But to counter this, investors could consider introducing a technology ETF into the portfolio, such as NDQ.
| Sector | INCM | HVST | NDQ |
| Information Technology | 1.2% | 2.9% | 51.1% |
| Communication Services | 6.1% | 4.2% | 15.2% |
| Consumer Discretionary | 2.6% | 6.6% | 12.9% |
| Health Care | 4.7% | 10.3% | 6.3% |
| Consumer Staples | 3.8% | 4.2% | 6.1% |
| Industrials | 3.3% | 6.9% | 4.7% |
| Materials | 3.8% | 11.5% | 1.5% |
| Utilities | 27.0% | 1.5% | 1.2% |
| Financials | 23.9% | 30.3% | 0.5% |
| Energy | 8.3% | 4.5% | 0.5% |
| Real Estate | 3.5% | 6.1% | 0.0% |
Source: Betashares. As at 31 July 2024. Total weights may not add up to 100% due to rounding or immateriality. Holdings, weights and values are subject to change. Provided for illustrative purposes only, not a recommendation to make any investment decision or adopt any investment strategy. Does not take into account the circumstances or risk tolerance of any particular investor.
The Set-And-Forgetter
If all this sounds like too much of a hassle to implement, an ‘all-in-one’ diversified ETF like DHHF Diversified All Growth ETF might be worth considering. DHHF holds a diversified portfolio of cost effective ETFs traded on the ASX and other global exchanges.
It offers exposure to around 8,000 large, mid, and small cap equities from Australia, the US, developed markets, and emerging markets.
Importantly, the ETF may be rebalanced on a periodic basis to ensure the portfolio doesn’t stray far from its target asset allocation. The management fee for DHHF is just 0.19% p.a9.
In conclusion
Achieving global diversification is easier than ever. Whether you’re seeking growth, income, or just a simple approach that allows you to spend less time working out your investments and more time enjoying the fruits of your labour, Betashares offers the tools to implement whatever strategy suits your needs.
There are risks associated with an investment in each Fund, including market risk, index tracking risk, sector risk, security specific risk, strategy risk and, for Funds with global exposure, international investment risk, country risk and currency risk. Investment value can go up and down. An investment in each Fund should only be considered after considering your particular circumstances, including your tolerance for risk. For more information on risks and other features of each Fund, please see the Product Disclosure Statement and Target Market Determination, both available at www.betashares.com.au.
References:
1. Source: Worldometers ↑
2. Source: World Bank ↑
3. Source: World Bank ↑
4. Other costs, such as transaction costs, may apply. Please refer to the PDS for more information. ↑
5. Source: Betashares ↑
6. As at 22 August 2024. Not a recommendation to invest in any of the companies listed. Betashares offers no guarantee these companies will remain in the portfolio. ↑
7. Past performance is not indicative of future performance. Yield is calculated by summing the prior 12-month per unit distributions divided by the closing net asset value per unit at the end of the relevant period. Yield will vary and may lower at the time of investment. ↑
8. Past performance is not indicative of future performance. Yield is calculated by summing the prior 12-month net or gross per unit distributions divided by the closing net asset value per unit at the end of the relevant period. Yield will vary and may lower at the time of investment. Franking level is total franking level over the 12 months to 31 July 2024. Not all Australian investors will be able to receive the full value of franking credits. ↑
9. Other costs, such as transaction costs, may apply. Please refer to the PDS for more information. ↑
Explore
Markets
2 comments on this
Hello, Can you please do an article on how the exchange rate effects things? For instance, if I thought an international ETF would go up 10% this year, but the AUD would go down by 20% wouldn’t I still be worse off? Or is it the other way? And isn’t there some ETFs that avoid this somehow? And does it even matter in the long term as the dollar stabilizes? Hopefully this makes sense to you, as it confuses me! Many Thanks
Hi Matt,
Thanks for the idea! We will take this on board for upcoming blogs.