Is your portfolio really diversified?
8 minutes reading time
- Technology
Produced in partnership with Nasdaq
The Nasdaq-100 Equal-Weighted™ Index (NDXE™) was launched to offer investors an equal-weighted alternative to tracking the same innovation-driven companies that are part of the Nasdaq-100® (NDX®), but with lower levels of concentration on a sector, size, or individual company basis. The index functions as a tactical complement to the Nasdaq-100, and is particularly useful as a means of maintaining meaningful exposure to the same fundamental drivers that have propelled the Nasdaq-100 higher, but with less concentration risk.
Australian investors now have the opportunity to invest in an equally-weighted portfolio of the Nasdaq-100 companies, with the launch of Betashares Nasdaq 100 Equal Weight ETF (ASX: QNDQ). QNDQ aims to track the performance of NDXE (before fees and expenses).
The following discussion of NDXE was written by Mark Marex, CFA, Senior Director, Nasdaq Index Research & Development.
Nasdaq-100 Equal Weighted™ Index:
Tactical Complement to the Nasdaq-100®
The Nasdaq-100 Equal-Weighted Index (NDXE) measures the performance of 100 of the largest non-financial companies listed on the Nasdaq Stock Market®, with each holding in the Index weighted equally.
Reasons to consider NDXE:
- Only ~7% exposure to the “Magnificent Seven” stocks, vs. ~39% for NDX (as of December 31, 2023)
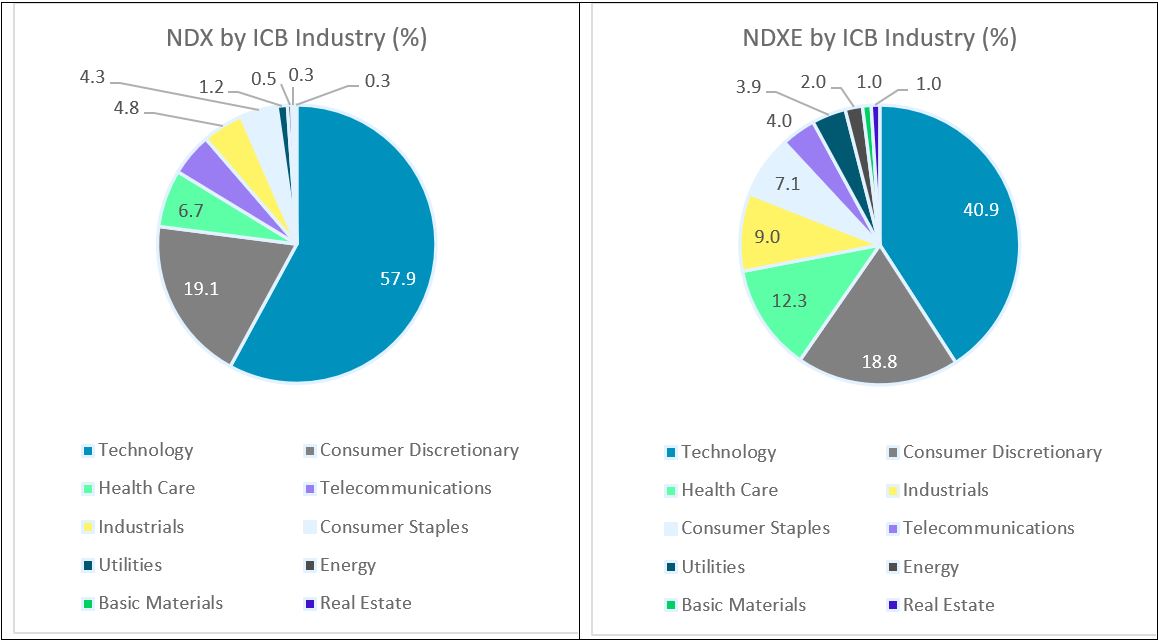
- Only ~41% exposure to the Technology sector (based on ICB Industry) vs. ~58% for NDX
- Only $191B weighted average market cap vs. $834B for NDX
- Market leadership is never guaranteed: of today’s 10 largest NDX companies, only Microsoft was ranked in the top 10 at the turn of the century:
| NDX Top 10 | December 31, 1999 | NDX Top 10 | December 31, 2023 | ||||
| Market Cap ($B) | Company Name | Market Cap ($B) | Company Name | ||||
| $602.4 | Microsoft Corporation | $2,994.4 | Apple Inc. | ||||
| $366.5 | Cisco Systems, Inc. | $2,794.8 | Microsoft Corporation | ||||
| $275.0 | Intel Corporation | $1,633.5 | Alphabet Inc. | ||||
| $159.5 | Oracle Corporation | $1,570.2 | Amazon.com, Inc. | ||||
| $150.6 | WorldCom Inc. | $1,223.2 | NVIDIA Corporation | ||||
| $130.8 | Dell Inc. | $789.9 | Tesla, Inc. | ||||
| $125.5 | Ericsson | $785.7 | Meta Platforms Inc. | ||||
| $121.8 | Sun Microsystems | $522.6 | Broadcom Inc. | ||||
| $116.2 | QUALCOMM, Inc. | $292.9 | Costco Wholesale Corporation | ||||
| $113.9 | Altaba, Inc. (f/k/a Yahoo!) | $271.6 | Adobe Inc. |
Nasdaq-100 Return Concentration: 2023 vs. Historical Record
NDX experienced an extraordinary run-up in 2023, up 53.8% (in USD) on a price-return basis. This was driven by eye-popping returns across its largest constituents – the “Magnificent Seven” of Apple, Microsoft, Alphabet, Amazon, Meta Platforms, Tesla, and Nvidia, which as a group gained 111.6% on average for the year.[1]
Since the Magnificent Seven is a fairly recent grouping preference by the investment community – and there have been multiple iterations of FANG/FAANG/FANGMA over the past decade – it may be simplest to consider an analysis of the top 10 largest index constituents (company-level), by weight, over each of the past 10 years to put 2023’s performance concentration in perspective.
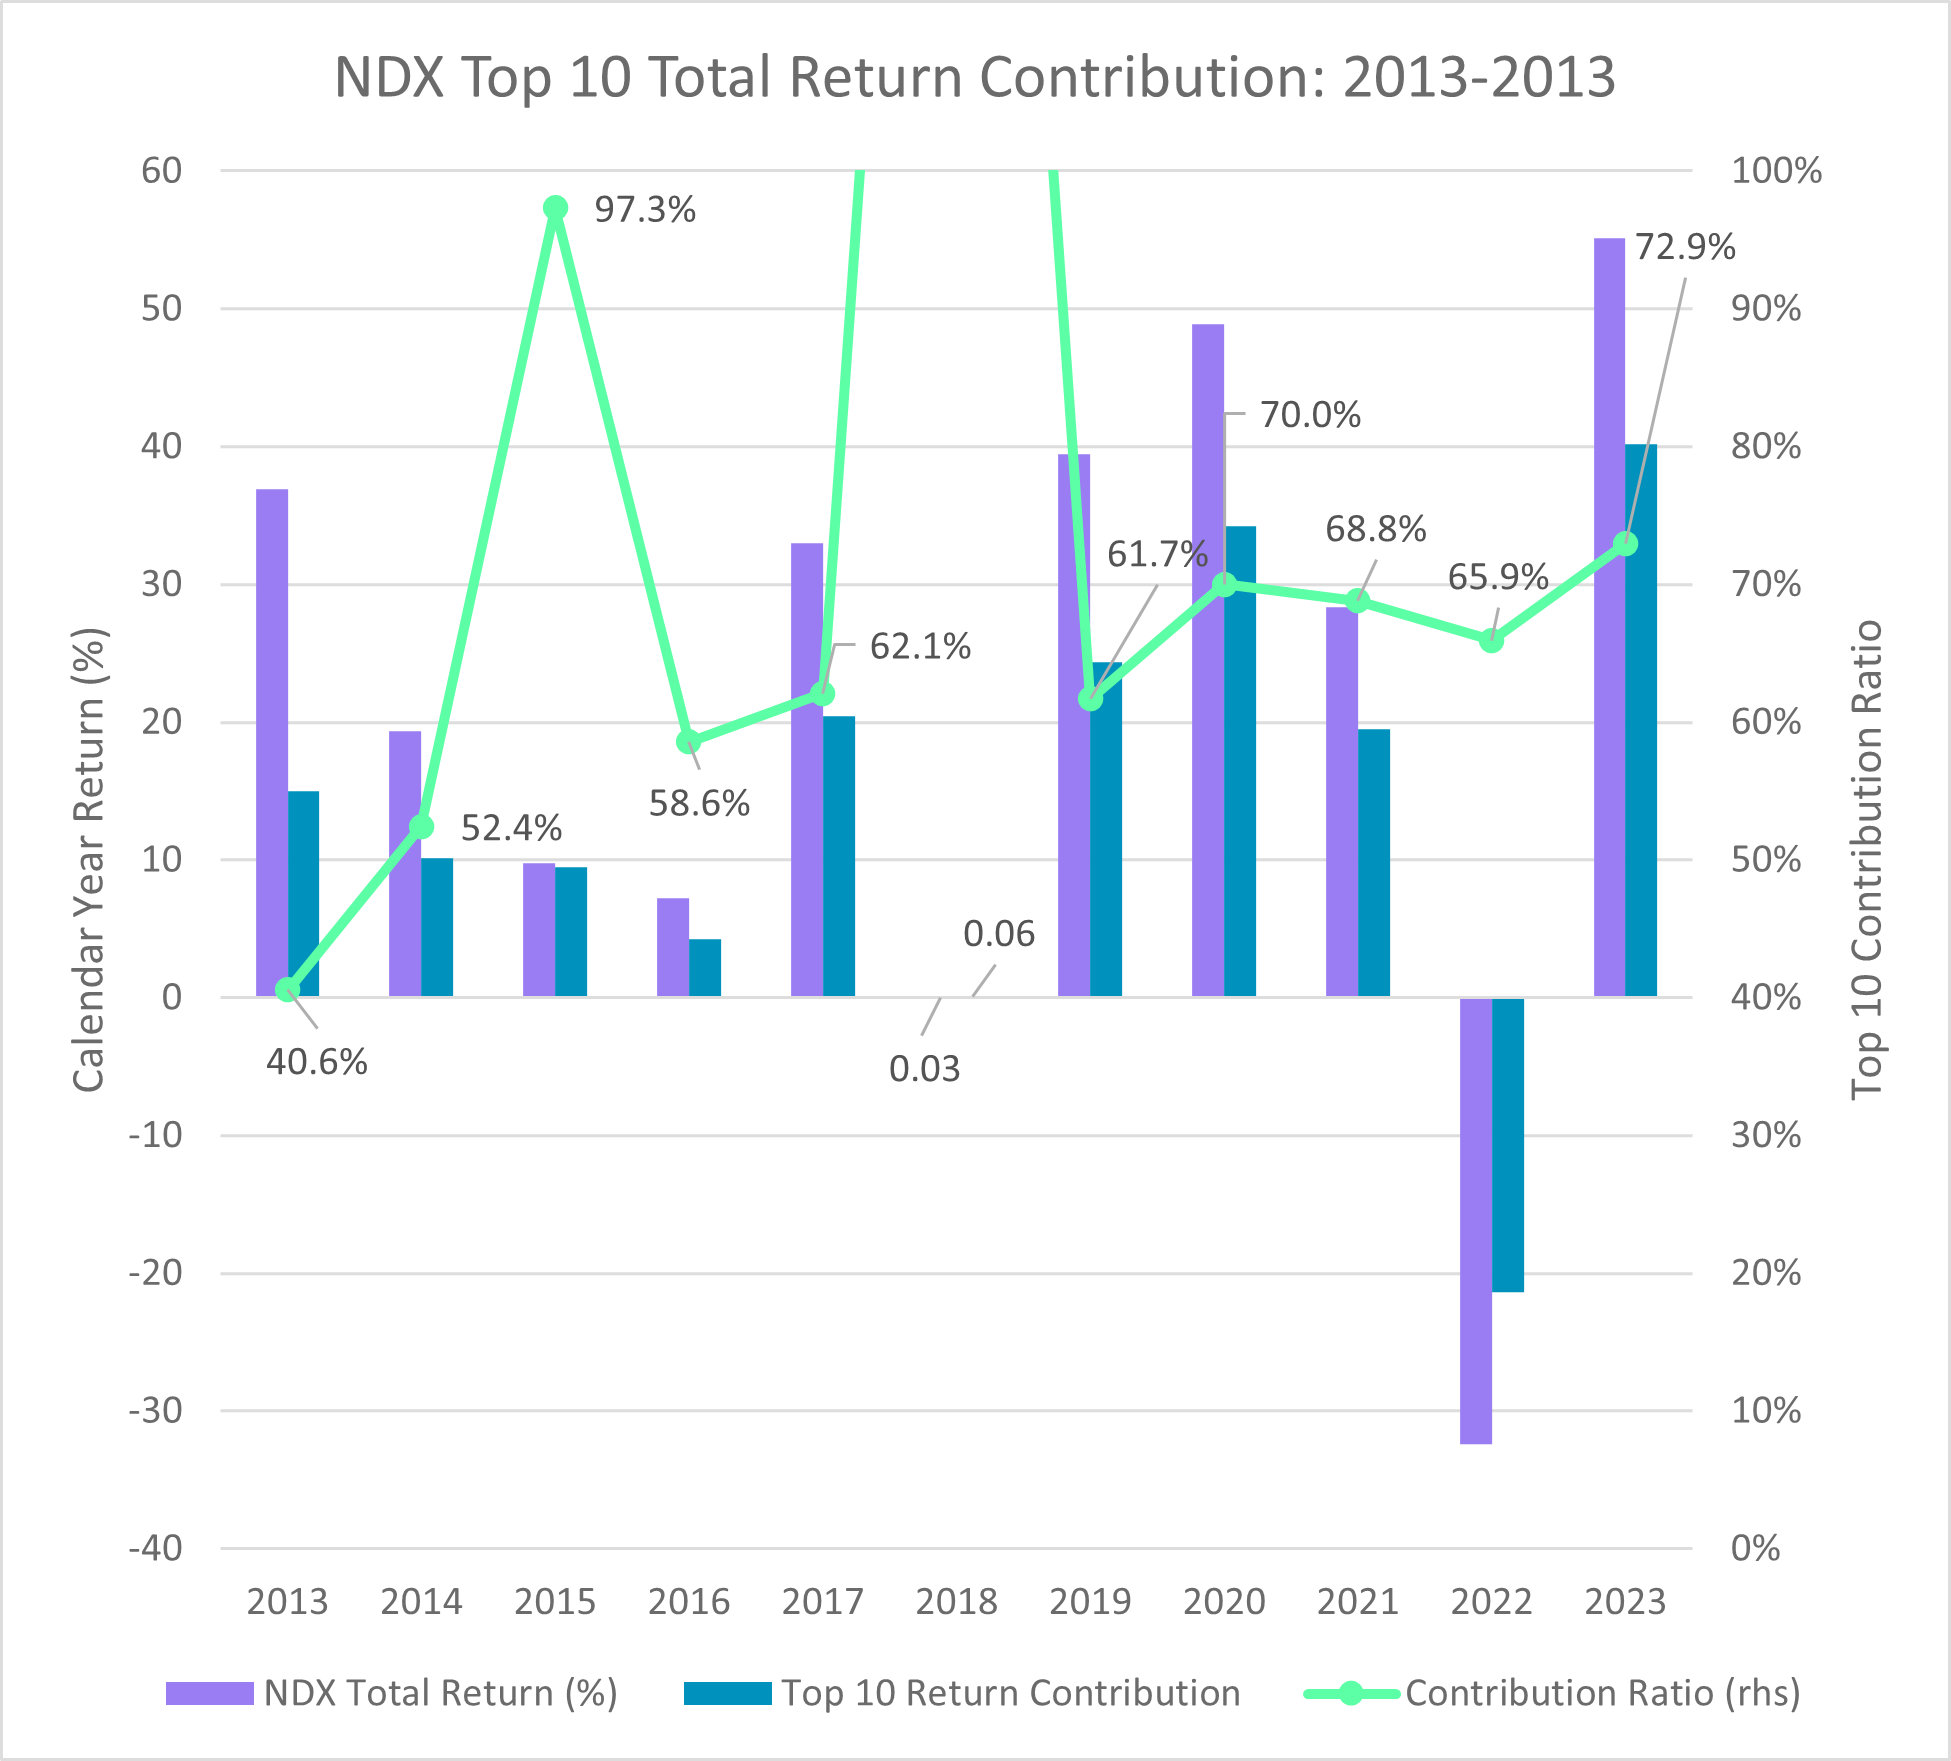
In 2023, the top 10 highest-weighted companies in the Nasdaq-100 (based on average weights throughout the year) contributed 40.2% of the index’s 55.1% total return, for a contribution ratio of 72.9%. This is indeed higher than any year in the past decade except 2015. On average, over the decade preceding 2023, the top 10 NDX weights contributed only 64.2% of the index’s returns (excluding consideration of 2018, during which the index returned 0.03%). This was, in turn, notably higher than the top 10’s cumulative contribution ratio of 56.0% observed from 2002-2012. The trend for NDX has thus been towards steadily higher performance concentration throughout much of the 21st century.
Past performance is not indicative of future performance. Returns shown are index returns and do not take into account ETF management fees and costs. You cannot invest directly in an index. Performance is shown in USD and therefore does not reflect performance in AUD terms, which would be affected by movements in the AUD/USD exchange rate.
NDX/NDXE Performance Gap: 2023 vs. Historical Record
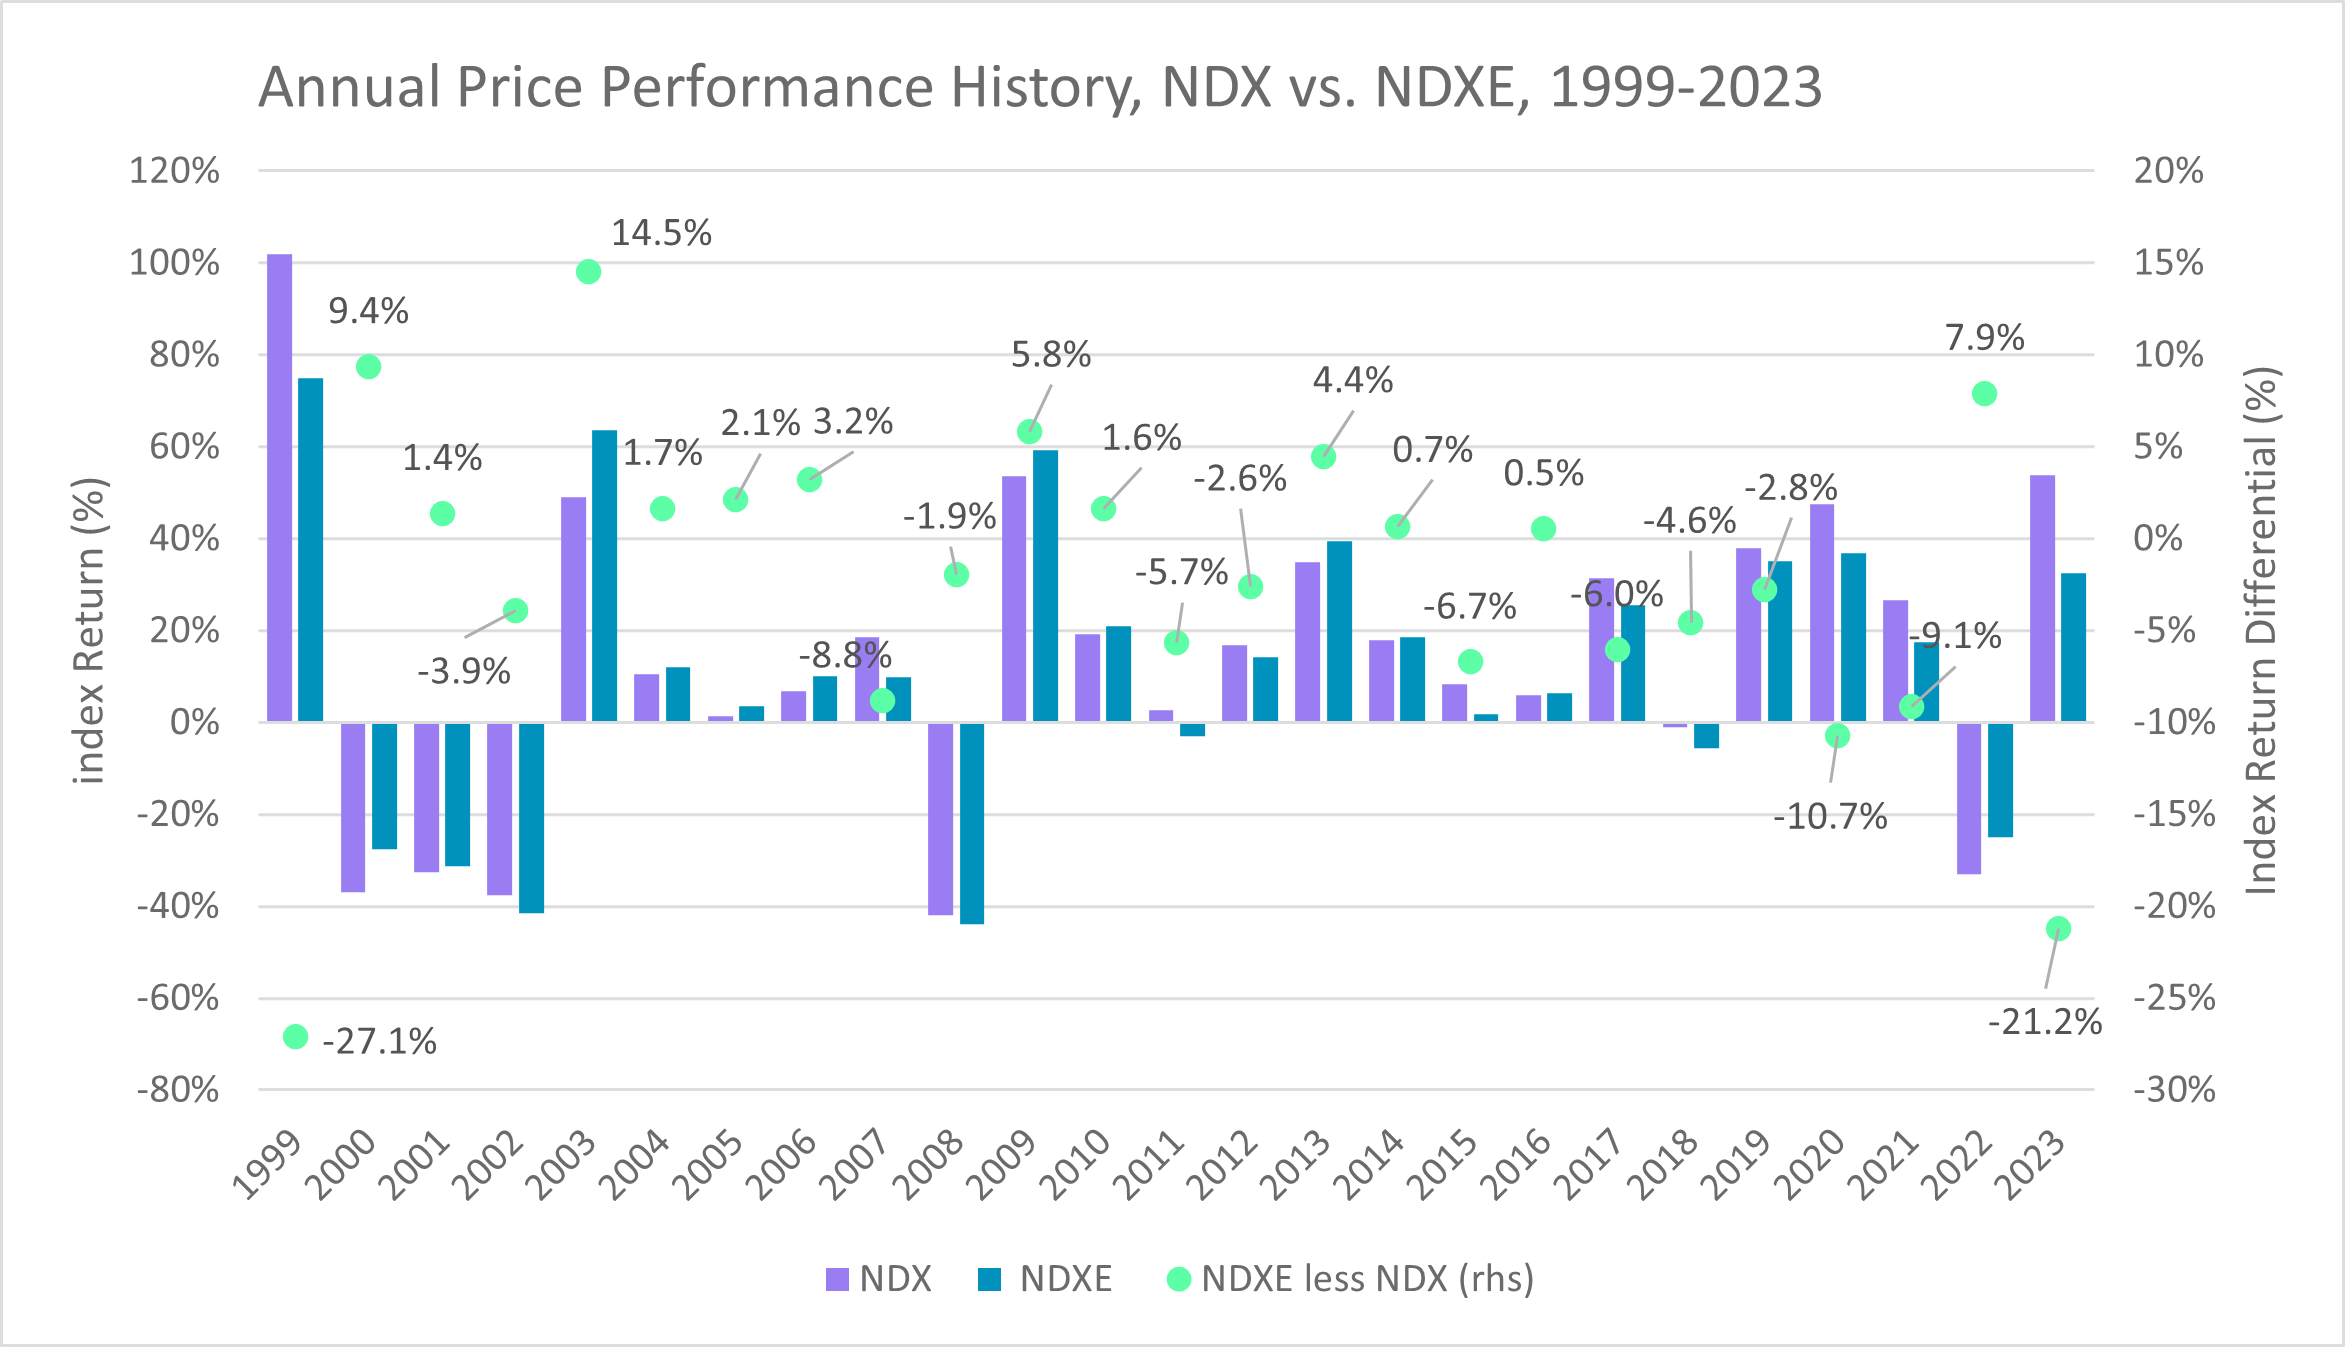
2023 witnessed the largest outperformance of NDX vs. NDXE since 1999, when the two indices gained 102.0% and 74.9%, respectively. Following that historic year, NDXE went on to outperform NDX six out of the next seven years. NDXE also outperformed NDX by approximately 8% in 2022’s bear market, and may again be primed for a period of relative outperformance if valuations across the rest of the indices’ constituents catch up to the Magnificent Seven.
Past performance is not indicative of future returns. Returns shown are index returns and do not take into account ETF management fees and costs. You cannot invest directly in an index. Performance is shown in USD and therefore does not reflect performance in AUD terms, which would be affected by movements in the AUD/USD exchange rate.
NDXE’s equal-weighting approach means that there is less of an implicit bet on mega-cap firms in general. Instead of a weighted-average market cap of $834Bn for NDX, NDXE’s average market cap of $191Bn reflects a 77% reduction in the index’s typical constituent size. If Microsoft, Amazon, Alphabet or Apple (currently weighted between 5-10% each in NDX) were to experience a particularly bad day or month or year (down 50%, for example), the impact of a loss is muted by approximately 80-90%, reducing total portfolio drag.
Indeed, this is what we observed in 2022 as the biggest NDX constituents entered bear markets and disproportionately drove losses in the index. Of the NDX’s 32.4% total-return loss for the year, the seven largest constituents were all ranked at the very bottom in terms of return contribution, down by 46% on average and contributing a loss of 21% — or nearly two-thirds of the overall index total, despite averaging just under half of the index weight. In contrast, these names contributed only 3.3% of the 24.3% loss in NDXE, or roughly one-seventh of the overall index total return.
NDX vs. NDXE: Sector (ICB Industry) Exposure Differentials
As of December 31, 2023, NDXE’s exposure to the Tech sector (per ICB Industry) is approximately 17 percentage points lower than NDX, with the bulk of the difference made up by increased exposures to Health Care, Industrials, and Consumer Staples:
NDX vs. NDXE: Top 10 Concentration
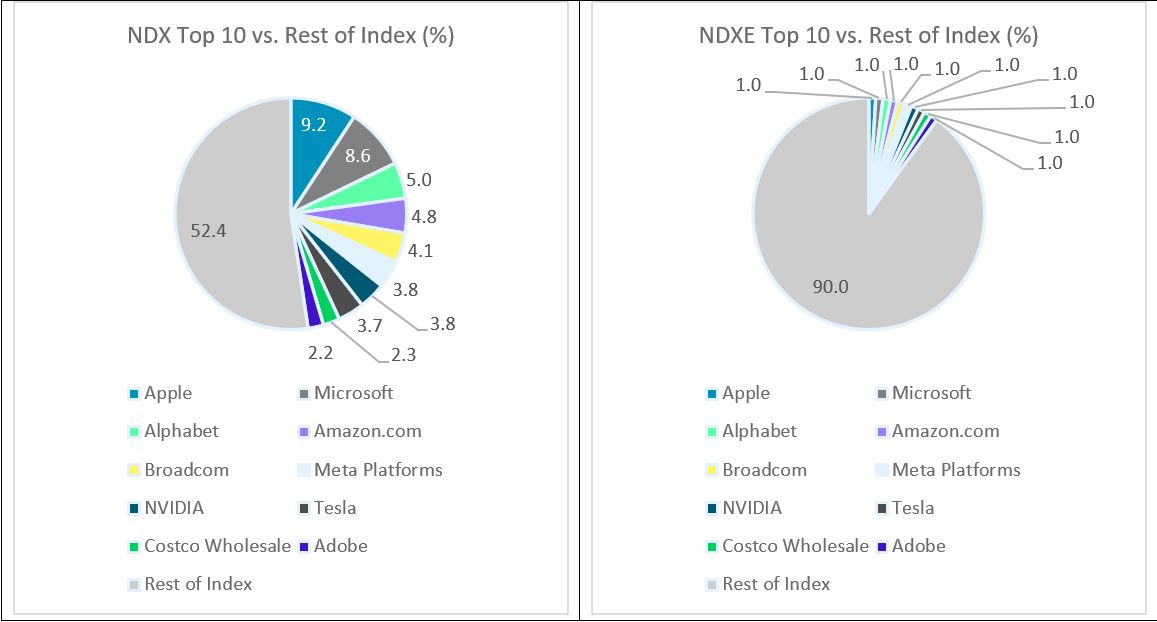
NDXE’s concentration in its top 10 constituent companies is only 10% of index weight vs. nearly 48% for NDX:
NDXE offers investors an alternative exposure to the Nasdaq-100 companies driving innovation
The Nasdaq-100 Index has been one of the best performing equity indices of the 21st century. Investors who recognise the benefits of tracking the index for its fundamental strength and exposure to innovation-driven growth may also consider its equal-weighted version, NDXE, as a tactical tool for navigating market fluctuations. For investors concerned about excessive concentration in the Nasdaq-100’s largest constituents or the Tech sector more broadly, NDXE offers a complementary exposure which has historically delivered similar performance much of the time.
Sources: Nasdaq Global Indexes, FactSet, Bloomberg.
There are risks associated with an investment in QNDQ, including market risk, country risk, currency risk and index methodology risk. Investment value can go up and down. For more information on risks and other features of the Fund, please see the Product Disclosure Statement and Target Market Determination available at www.betashares.com.au.
Betashares Capital Ltd (ABN 78 139 566 868 AFSL 341181) (“Betashares”) is the issuer of the Fund. The information in this article is issued by Betashares, is general only, is not personal advice, and is not a recommendation to buy units or adopt a particular strategy. It does not take into account any person’s financial objectives, situation or needs. Any person wishing to invest should read the relevant PDS and TMD from www.betashares.com.au and obtain financial advice in light of their individual circumstances.
Nasdaq®, Nasdaq-100® and Nasdaq-100 Index® are registered trademarks of Nasdaq, Inc (which with its affiliates is referred to as the “Corporations”) and are licensed for use by Betashares. The Fund is not issued, endorsed, sold or promoted by the Corporations. The Corporations make no warranties and bear no liability with respect to the Fund. The Corporations make no recommendation to buy or sell any security or any representation about the financial condition of any company. The information contained above is provided for informational and educational purposes only, and nothing contained herein should be construed as investment advice, either on behalf of a particular security or an overall investment strategy. Statements regarding Nasdaq-listed companies or Nasdaq proprietary indexes are not guarantees of future performance. Actual results may differ materially from those expressed or implied. Past performance is not indicative of future results. Investors should undertake their own due diligence and carefully evaluate companies before investing. ADVICE FROM A SECURITIES PROFESSIONAL IS STRONGLY ADVISED.
- Past performance is not indicative of future returns. ↑
