The strategy that has generated $3.6 billion in returns over 10 years
6 minutes reading time
- Global shares
- Technology
While the investment returns available from picking individual stocks can be attractive, the fact remains that stock picking is hard. Per Figure 1, the best-performing 4% of listed companies explained the net gain for the entire US stock market from 1926 to 2018, as the performance of other stocks collectively matched Treasury Bills (the ‘risk-free rate’)1.
Figure 1: Illustrative long-term individual stock return – US stock market
Source: Hendrick Bessembinder. As at September 2018.
While this may help to explain why poorly diversified, ‘high-conviction’ investment strategies often underperform market averages – it also raises further questions. One being, which broad-market stock indices should Australian investors consider?
Major US stock indices
Relative to other global markets, US stock indices have performed strongly in recent decades. The US market contains three main representative stock indices:
- The Dow Jones Industrial Average (DOW). Comprising 30 stocks listed on the New York Stock Exchange (NYSE) and Nasdaq Stock Market (NASDAQ), as determined by the Wall Street Journal.
- The S&P 500. This index holds the 500 largest companies listed on the NYSE and NASDAQ, by market-capitalisation. Given its size, the S&P 500 is often considered the ‘best gauge’ of the US sharemarket.
- The Nasdaq Composite Index. Containing more than 3,000 companies, all of which are listed on the NASDAQ2. The Nasdaq 100 Index contains a subset of the Composite Index, holding the largest 100 non-financial companies listed on NASDAQ.
Figure 2: Three major US stock indices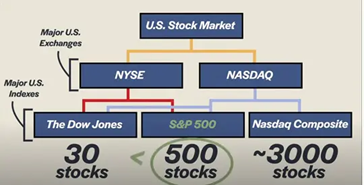
Source: bemoneyaware.com, 2020.
Why the Nasdaq 100 is worth considering
Since the IT bubble of the 1990s and early 2000s, the Nasdaq 100 has become one of the most prevalent global benchmarks; favoured as an aggregate index of US growth companies. Below are three reasons to consider an investment in the Nasdaq-100.
1. Company growth – amid COVID-19 pandemic
The Nasdaq 100 has become a mainstay benchmark of the US market following rapid growth of its constituent stocks in recent decades. It is a manifestation of the key themes of globalisation, digitisation and innovation.
While the COVID-19 pandemic devastated much of the global economy, Nasdaq-100 companies Apple, Amazon, Alphabet, Meta Platforms, Tesla, PayPal, NVIDIA, Zoom and Moderna all thrived.3
Zoom was a clear ‘winner’ of pandemic, with use rapidly expanding as global lockdowns forced a transition to remote working. Over the course of June 2020, Zoom reached 300 million daily meeting participants, up +2900% compared to December 20194. While participant numbers have declined following a global reopening, the structural impact of the coronavirus on work flexibility has seen usage remain elevated from pre-pandemic levels.
Moderna also found great success amid the pandemic, with the development of a coronavirus vaccine. The Massachusetts-based biotech generated $18.5bn in revenue in CY2021, an increase from $803m in 2020 (+2300%)5.
There is of course a cyclical nature to index investing, where old blood is removed, and new blood is brought in. 2021 saw the additions of Airbnb, Cloudstrike and Honeywell International to the Nasdaq-1006.
2. Constituent stocks dominate global brands
Investing in the Nasdaq 100 means buying into the world’s pre-eminent brands. It provides access to themes such as AI, big data, cloud, biotech and robotics – all of which have exhibited strong growth and forward application.
Many of the Nasdaq 100’s constituent companies are heralded among global brand power rankings. Forbes’ ‘World’s Most Valuable Brands’ (2021) listed Apple at 1st, Google 2nd, Microsoft 3rd, Amazon 4th, and Facebook 5th7. These are the Nasdaq 100’s top five stocks by weight.
Brand Finance, Kantar and Interbrand, among other publishers, also included these companies among the top 10 in power rankings8. Remaining at the epicentre of global transformation, these companies are likely to continue playing leading roles in the world over the coming decade.
3. Historic performance and discounted valuations
The Nasdaq 100’s performance has surpassed its peers over the long term. Over the past 15 years, the Nasdaq 100 has considerably outperformed the S&P 500, cumulatively returning 705.5% through end-August 2022 – almost double the S&P 500’s 362.4% return.
Figure 3: Cumulative Total Return Performance – Nasdaq 100 Index versus S&P 500 Index (USD)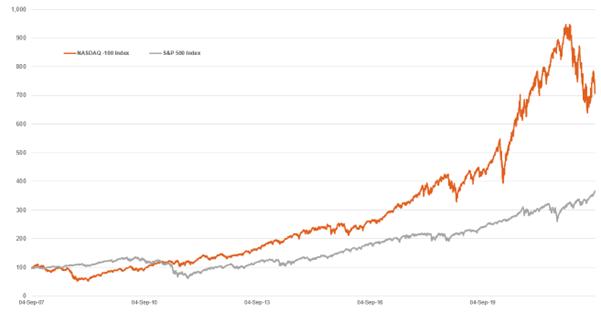
Source: Bloomberg, Betashares. As at 31 August 2022. Past performance is not an indicator of future performance. Returns in US Dollars. Graph compares the performance of two indices, not related fund performance, and therefore does not take into account fund management fees and costs. You cannot invest directly in an index.
This was achieved with somewhat higher volatility of 22.8% p.a. for the Nasdaq-100 versus 20.4% p.a. for the S&P 500. Though if a more recent period is used, which excludes the effects of the Global Financial Crisis in 2007-2009, the difference in volatility is greater – 20.3% p.a. versus 16.8% p.a. respectively over 10 years.
Since 2003, the average annual growth rate of Nasdaq 100 constituent companies has been +21% in terms of sales, +13% in terms of earnings, and +26% in terms of dividends – all while maintaining double-digit annual growth10.
Figure 4 depicts the Nasdaq 100’s (NDX) price-to-earnings (P/E) ratio. At a basic level, a P/E ratio is a way to measure how expensive a company’s share price is (dividing a company’s share price by its annual earnings per share). NDX’s forward P/E ratio is currently 26.89x, trading at a steep discount to recent highs.
Figure 4: NDX P/E Ratio (Trailing 5-Years)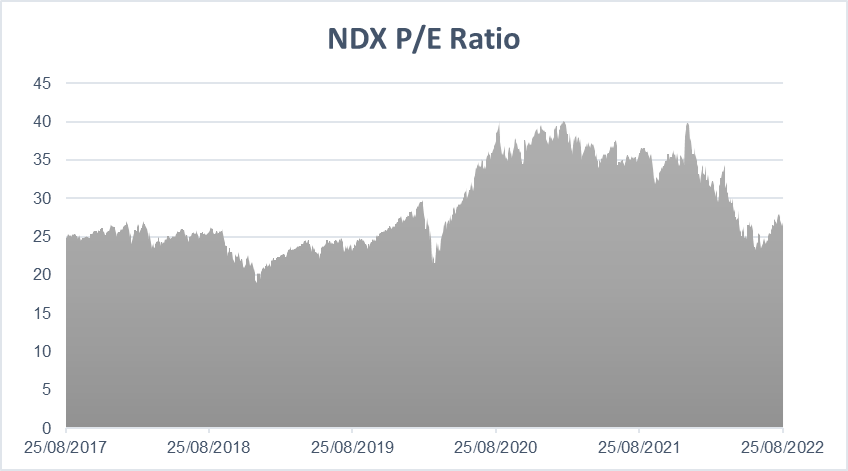
Source: Bloomberg. As at 25 August 2022. Past performance is not an indicator of future performance.
How can Australian investors gain exposure to the Nasdaq-100?
Australian investors can gain exposure to the Nasdaq-100 through the Betashares NASDAQ 100 ETF (NDQ) and the Betashares NASDAQ 100 ETF – Currency Hedged (HNDQ).
| There are risks associated with investment in NDQ and HNDQ, including market risk, country risk and sector risk. For more information on the risks and other features of each fund, please see the fund’s Product Disclosure Statement and Target Market Determination which are available at www.betashares.com.au. |
1. Bessembinder, Hendrik. “Journal of Financial Economics”. September 2018, Volume 129, Issue 3, Pages 440-457.
2. Nasdaq. “Nasdaq Equity Indexes.” Nasdaq, www.nasdaq.com/solutions/nasdaq-equity-indexes.
3. Iqbal, Mansoor. “Zoom Revenue and Usage Statistics (2022).” Business of Apps, 30 June 2022, www.businessofapps.com/data/zoom-statistics.
4. Pharmaceutical Technology. “Moderna reports $18.5bn total revenue in full-year 2021.” Pharmaceutical Technology, 28 July 2022, www.pharmaceutical
technology.com/news/moderna-reports-revenue-2021.
5. Nasdaq. “3 Reasons Why Investing in the Nasdaq-100 is Effective.” Nasdaq, 20 July 2022 www.nasdaq.com/articles/3-reasons-why-investing-in-the-nasdaq-100-is-
effective.
6. Swant, Marty. “The World’s Most Valuable Brands.” Forbes, www.forbes.com/the-worlds-most-valuable-brands.
7. Brand Finance. “Global 500 2022 Ranking.” Brand Finance, brandirectory.com/rankings/global/table. Interbrand. “Best Global Brands 2021.” Interbrand,
interbrand.com/best-global-brands/. Kantar. “What are the most valuable brands in 2022.” Kantar, www.kantar.com/inspiration/brands/what-are-the-most-
valuable-global-brands-in-2022.
8. Nasdaq. “3 Reasons Why Investing in the Nasdaq-100 is Effective.” Nasdaq, 20 July 2022 www.nasdaq.com/articles/3-reasons-why-investing-in-the-nasdaq-100-is-
effective.

